Power BI: Microsoft Income Statement Power BI: Microsoft Income Statement
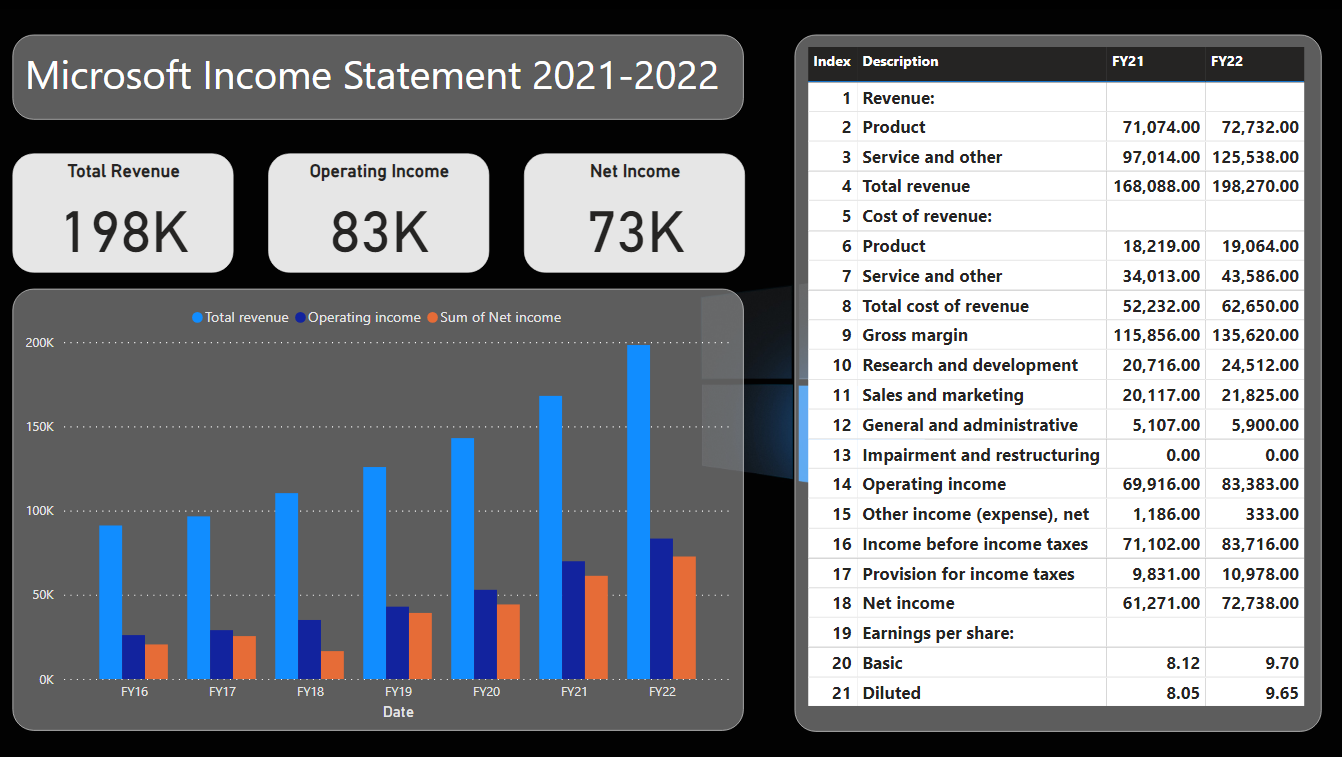
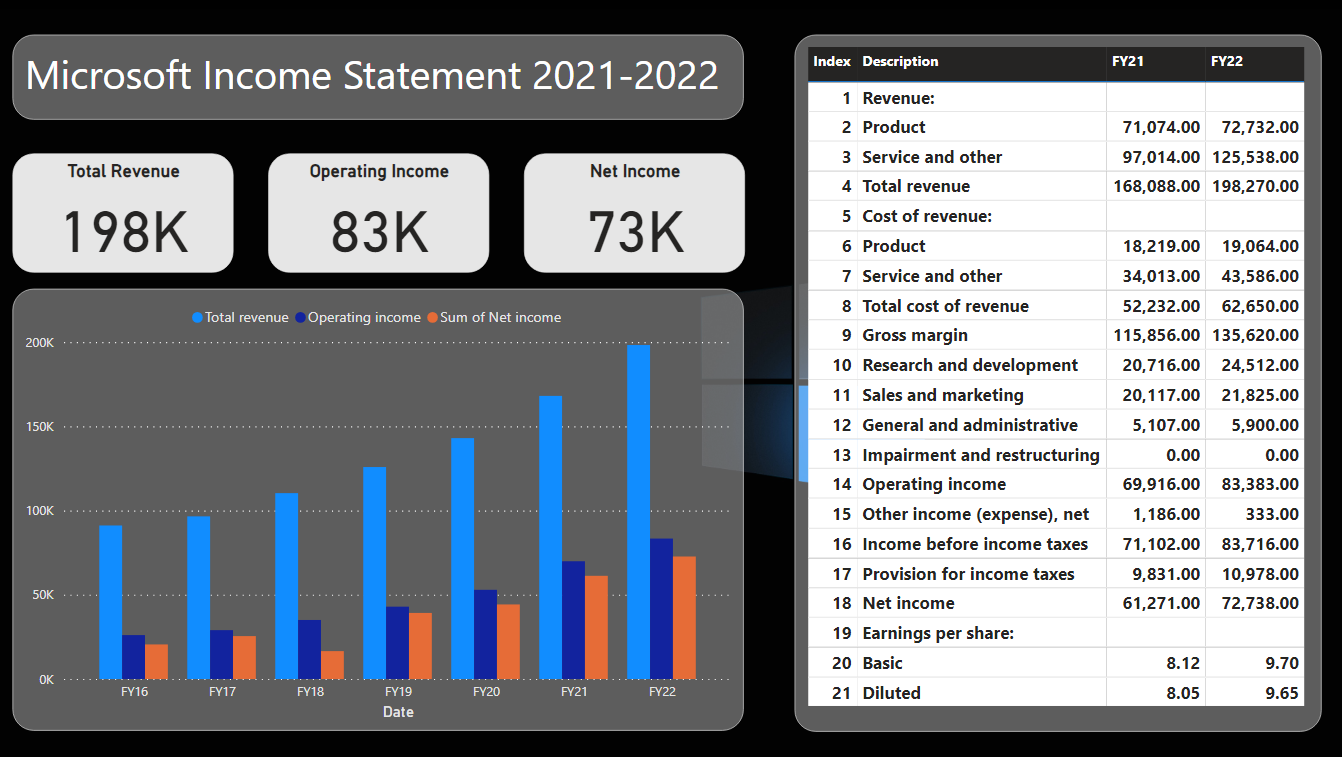
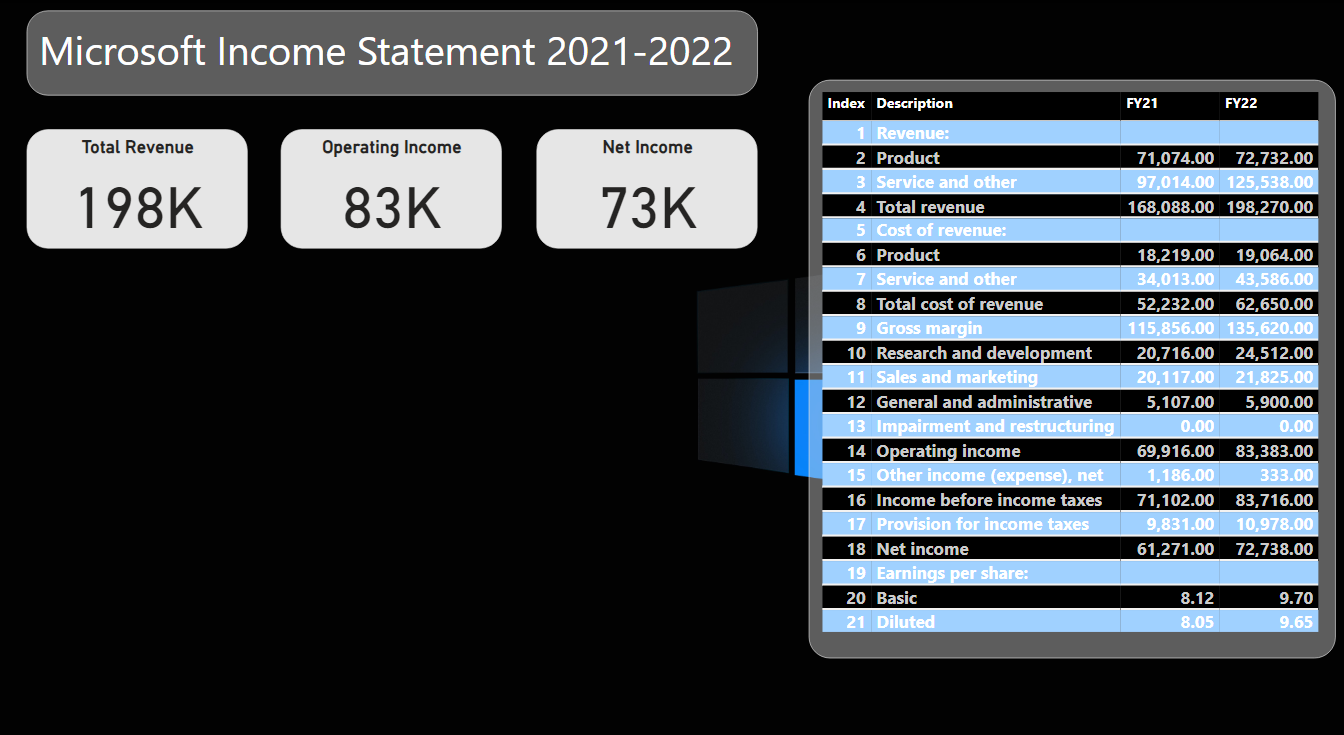
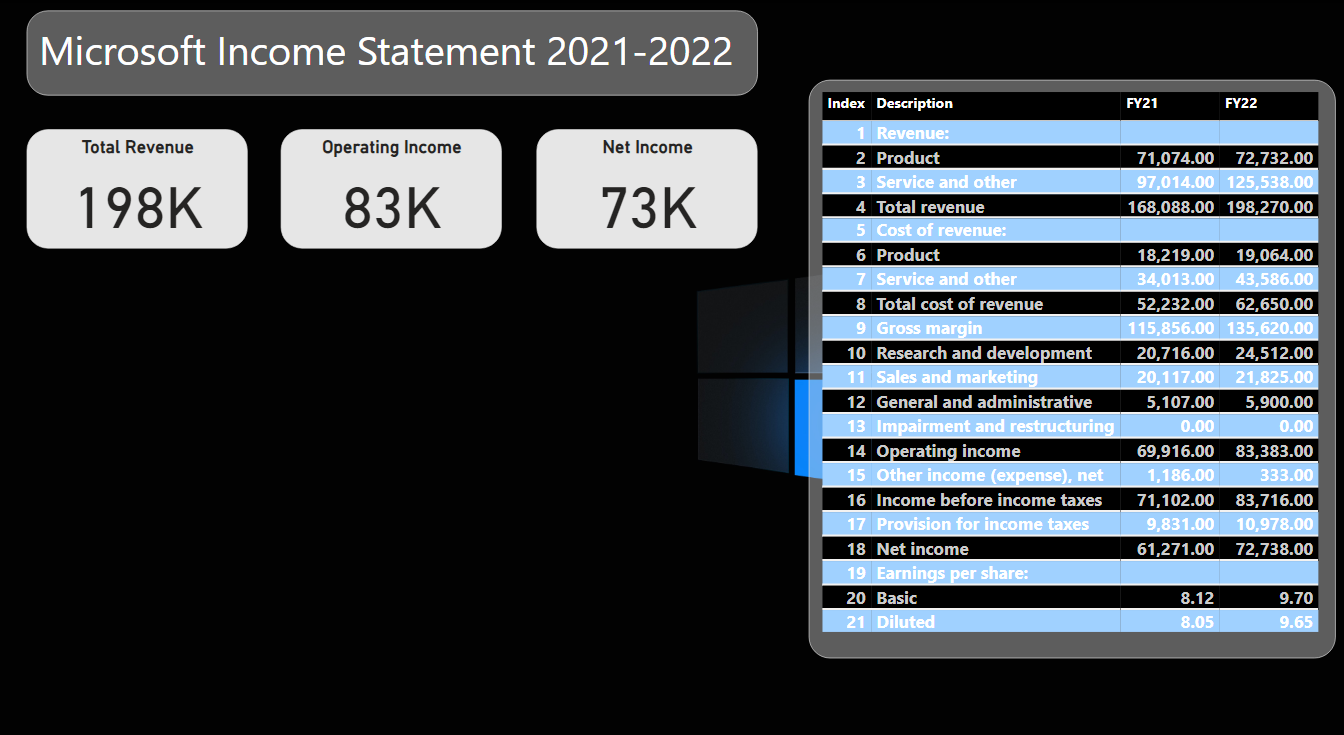
I successfully completed a project focused on building an income statement dashboard using Power BI. Leveraging data sourced from Microsoft's investor website, I meticulously imported and transformed the information, resulting in visually compelling tables, cards, and charts. This project has equipped me with the expertise to proficiently create comprehensive financial statement dashboards enriched with diverse and impactful visualizations.
Save the Financial statement file from:
https://www.microsoft.com/en-us/investor/earnings/FY-2023-Q3/income-statements
- Import the yearly income table into power bi
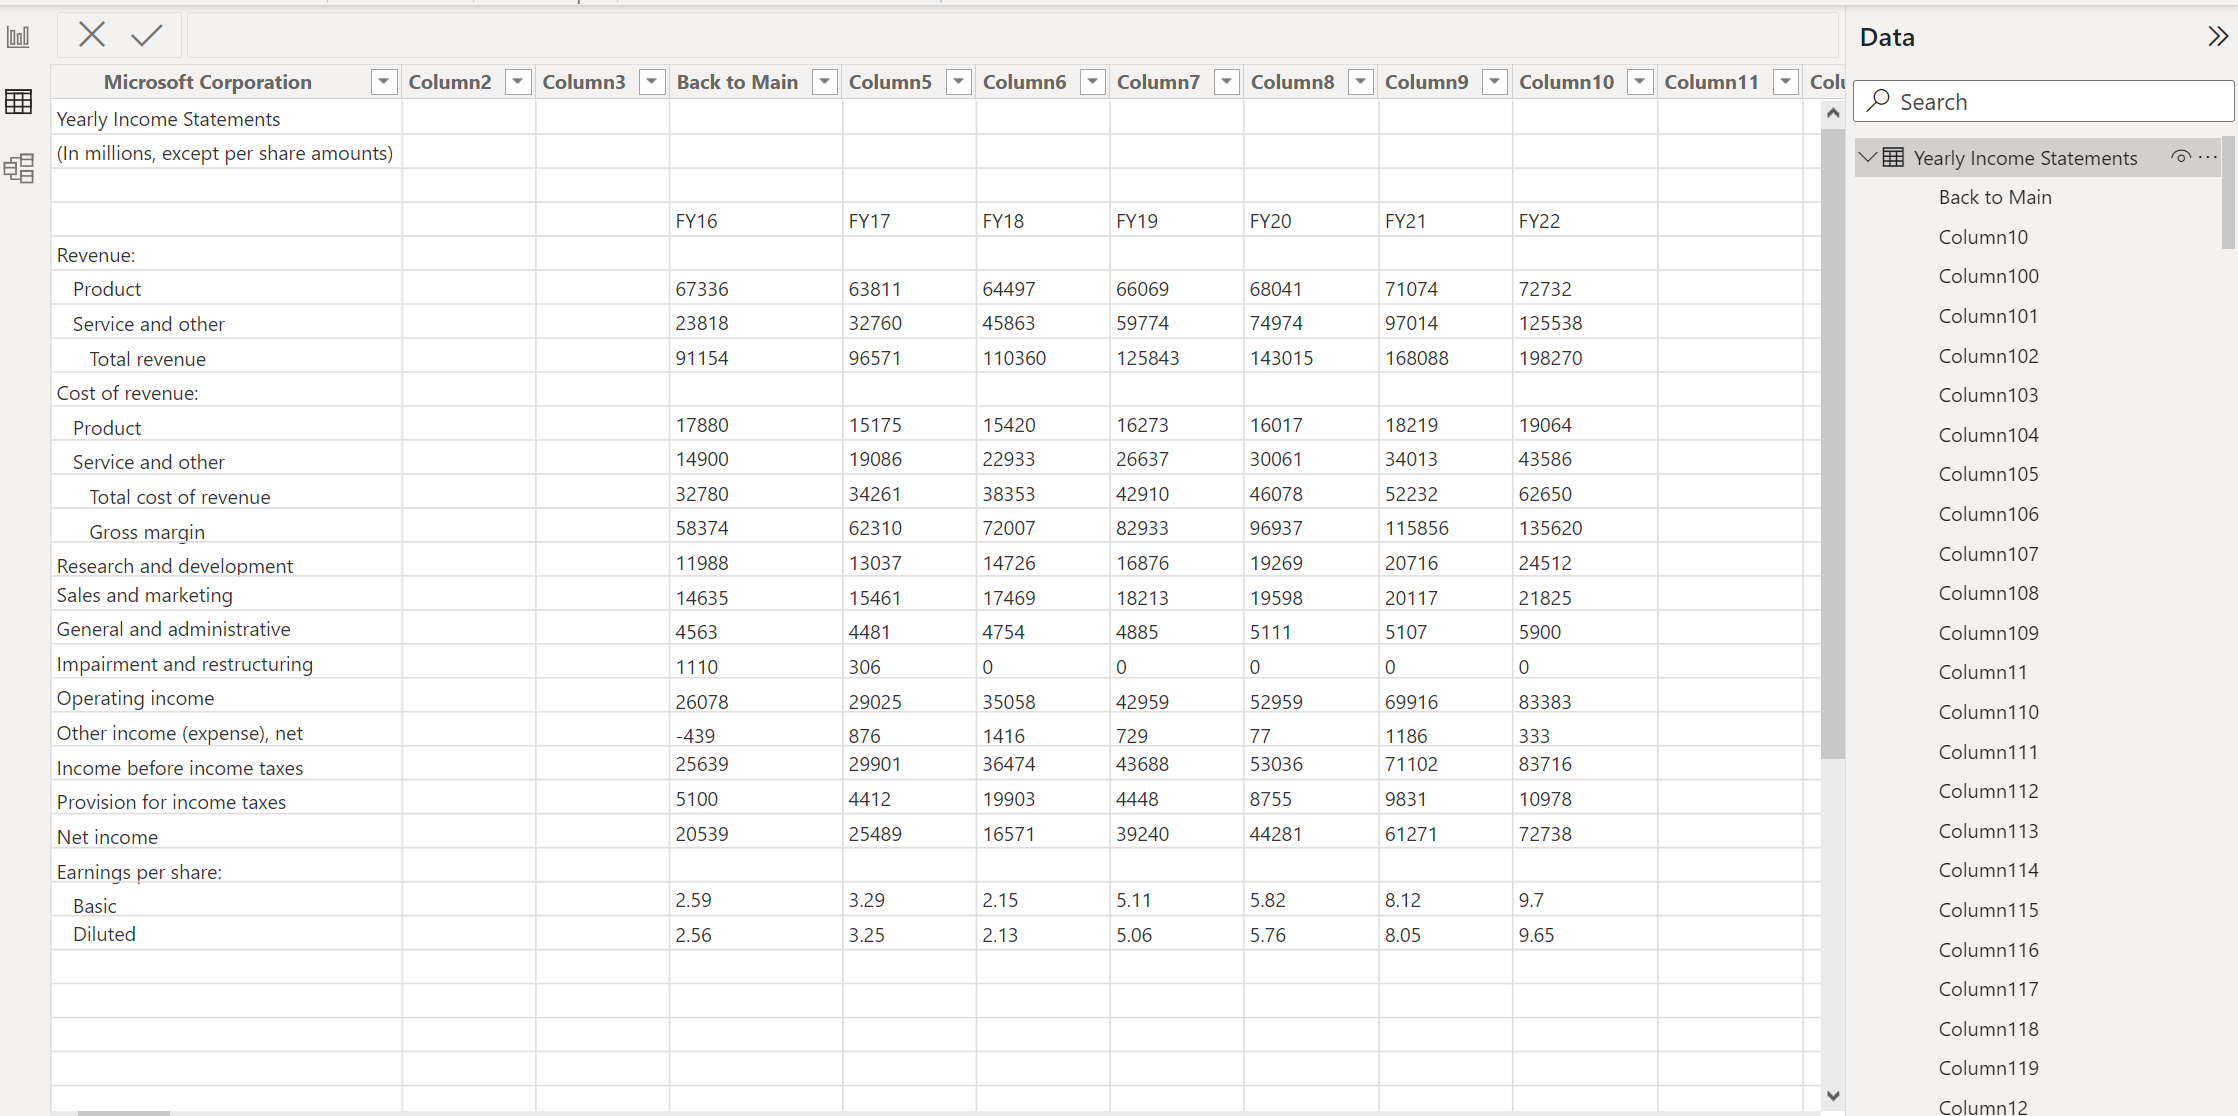
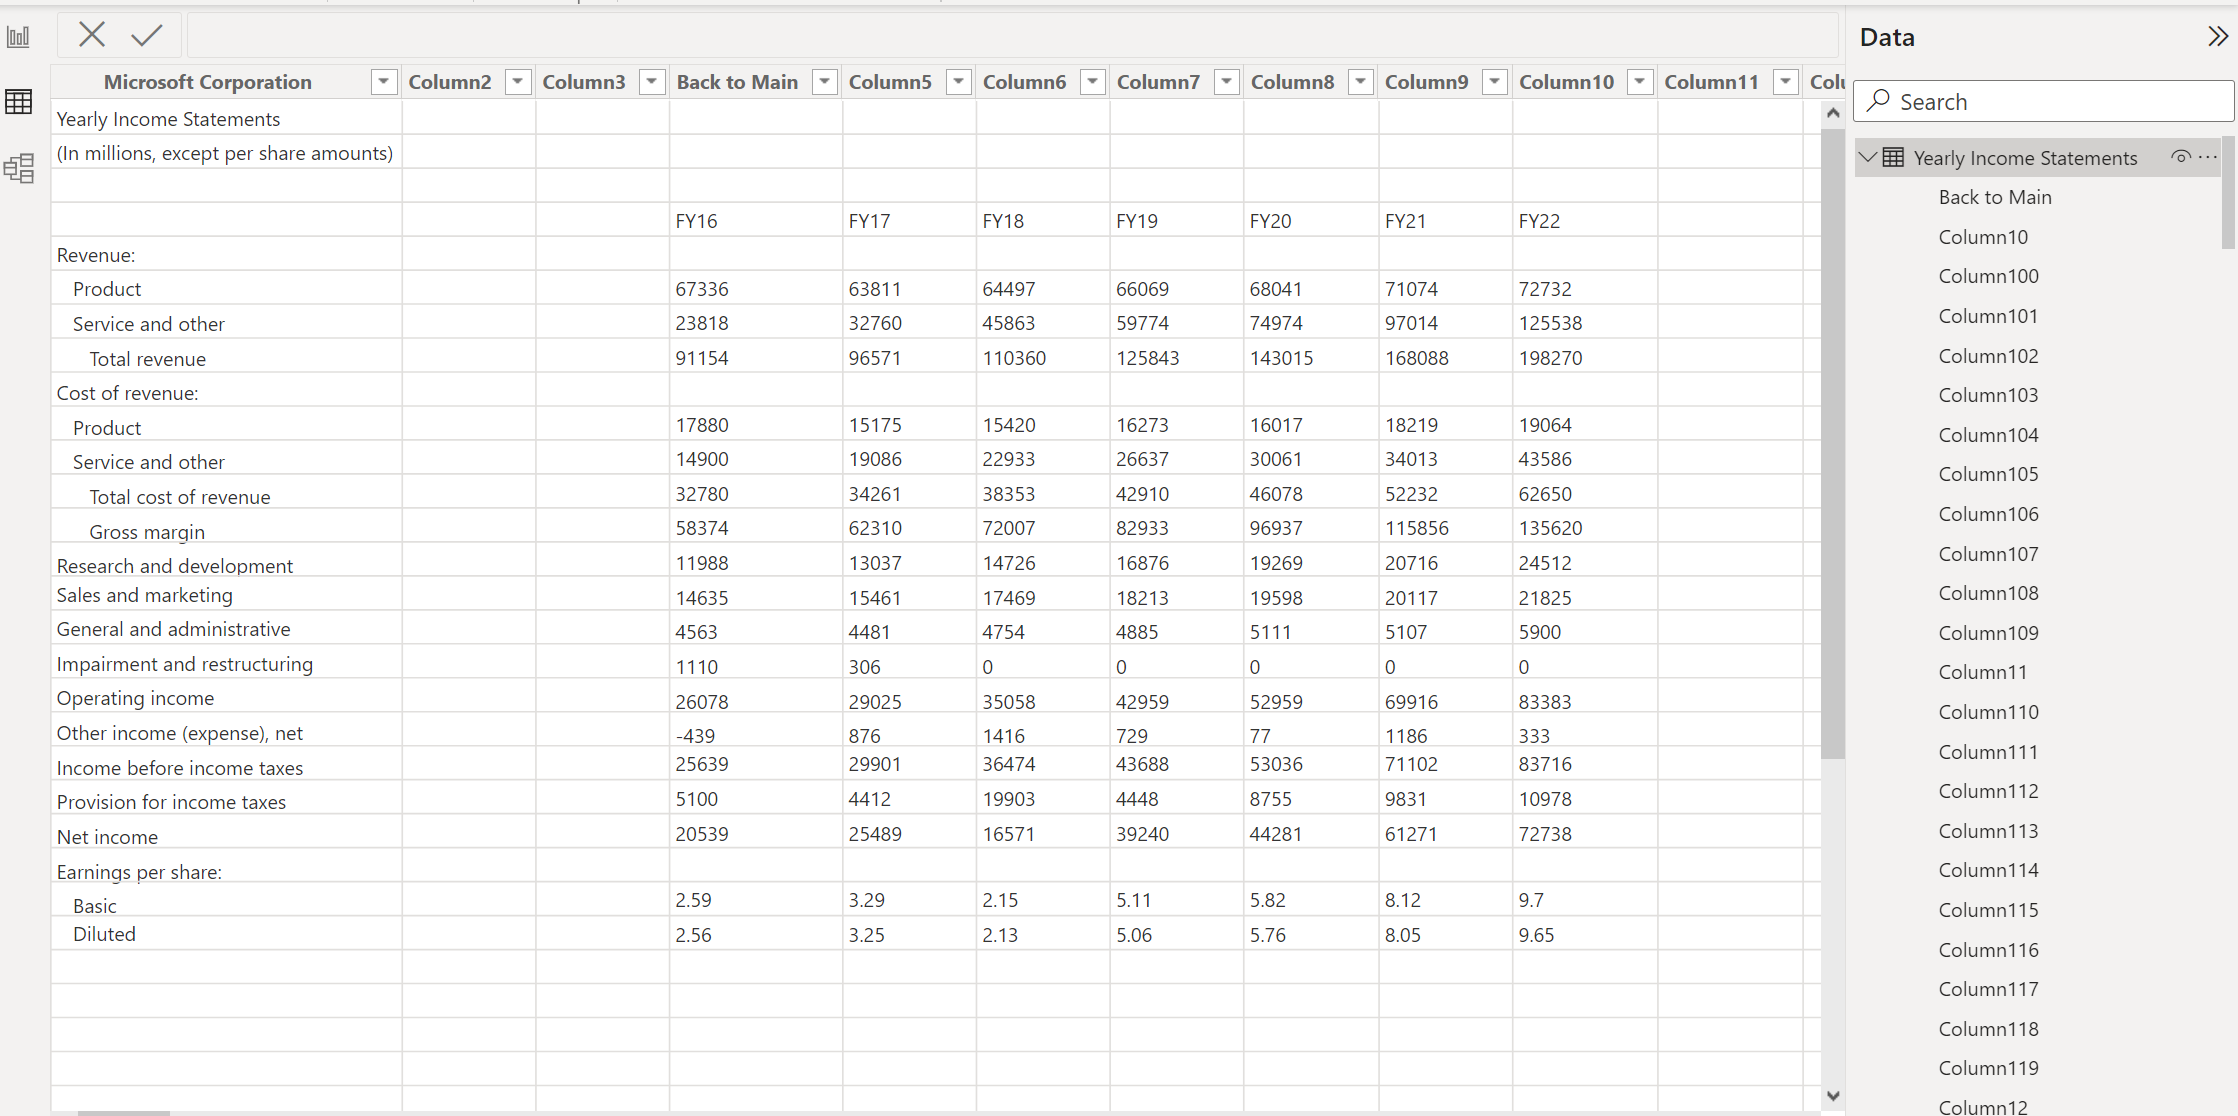
- Do some data cleaning and transformations
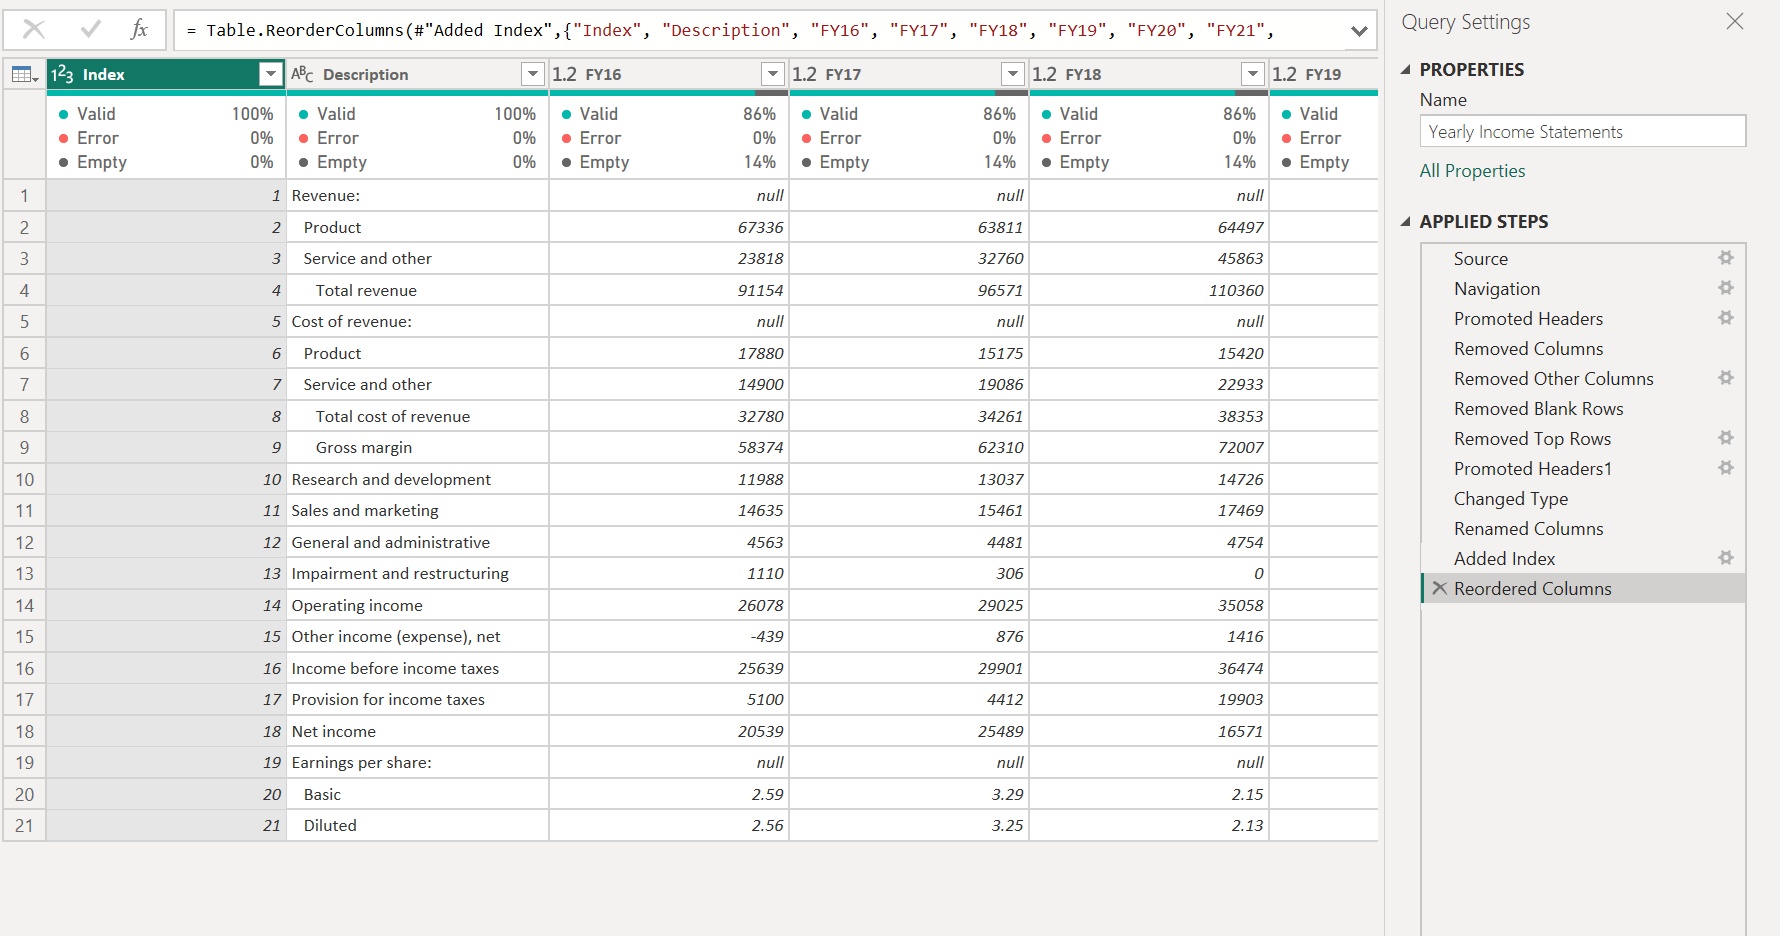
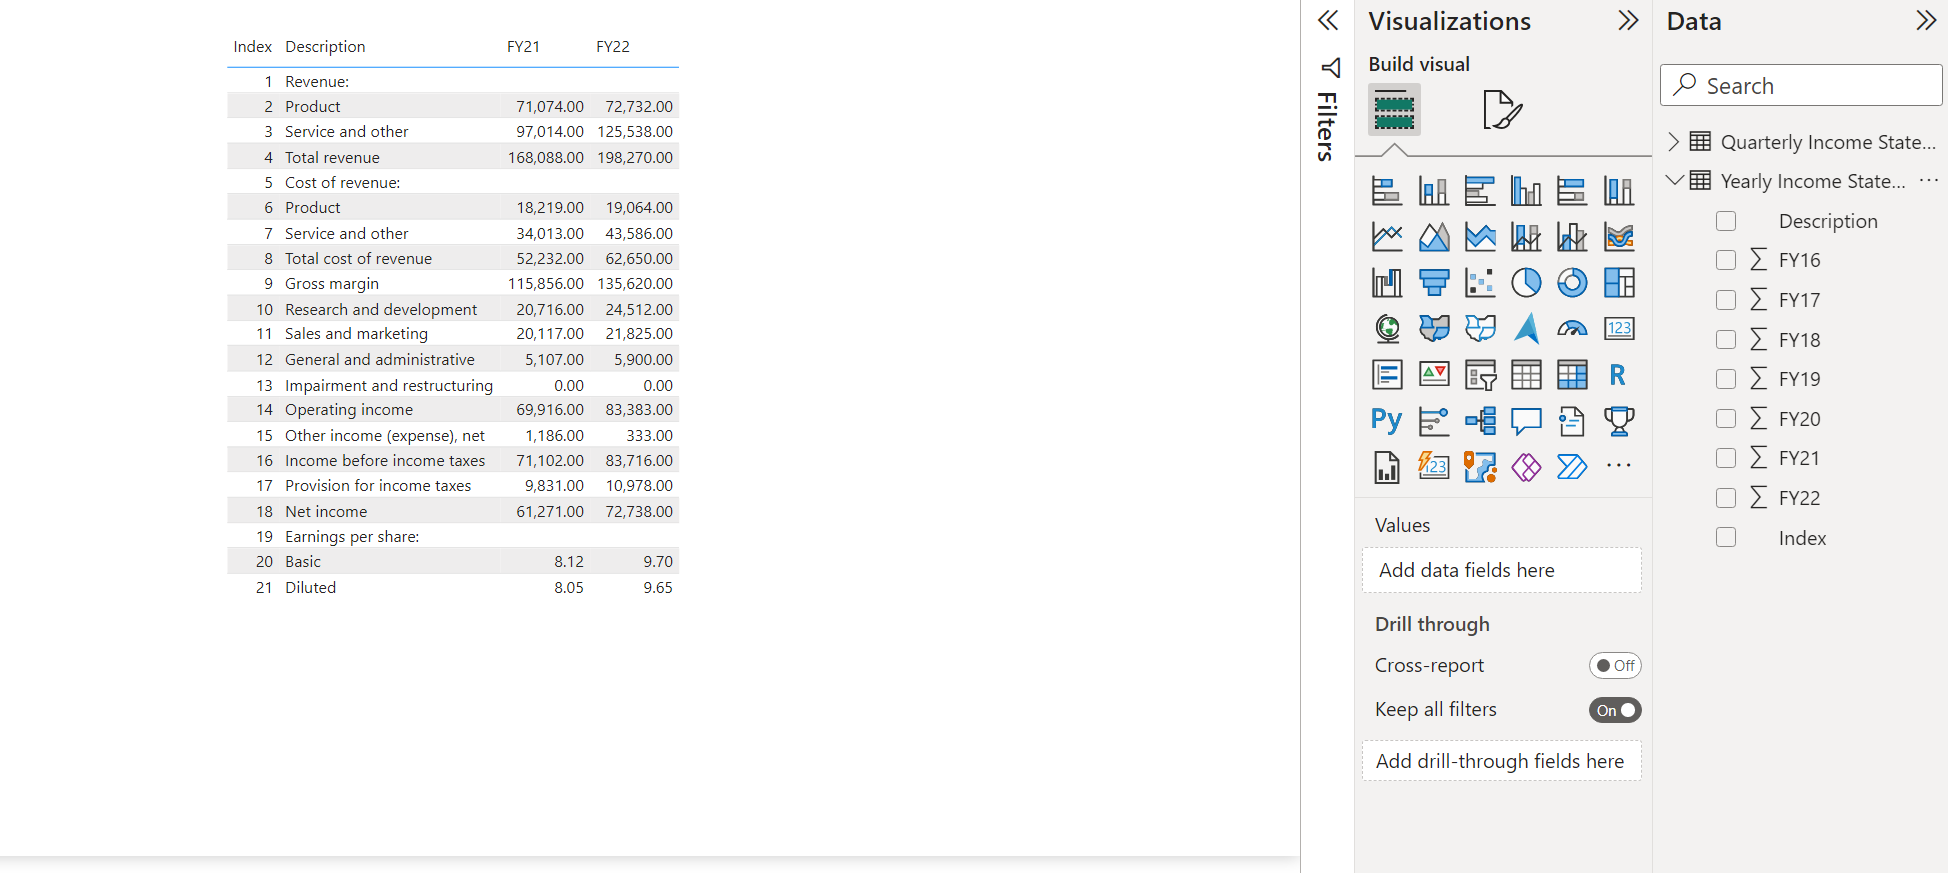
- create a table with the following fields added
- Download the below image


- Add some formating style and a title
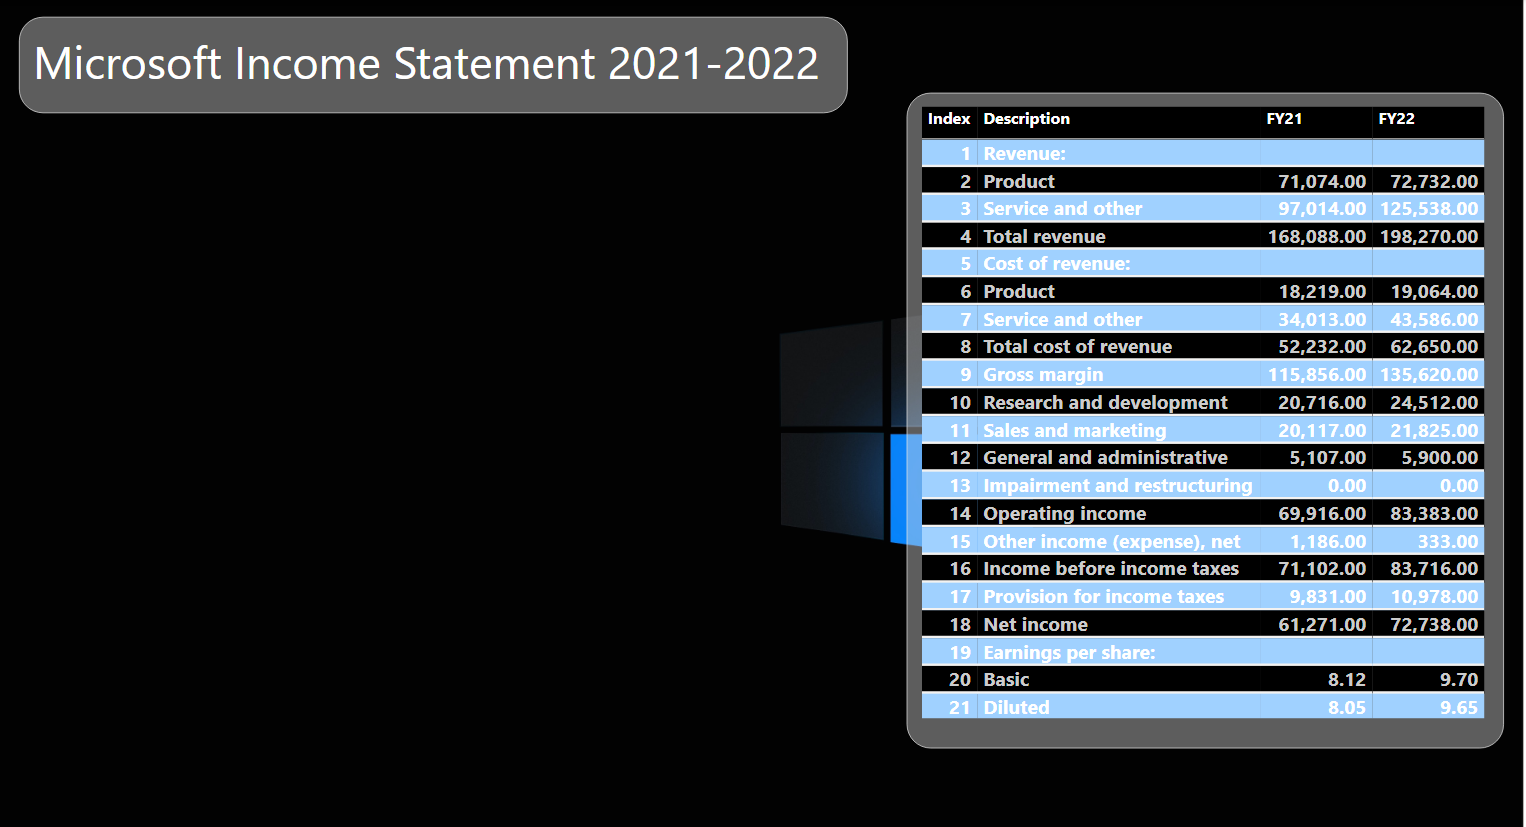
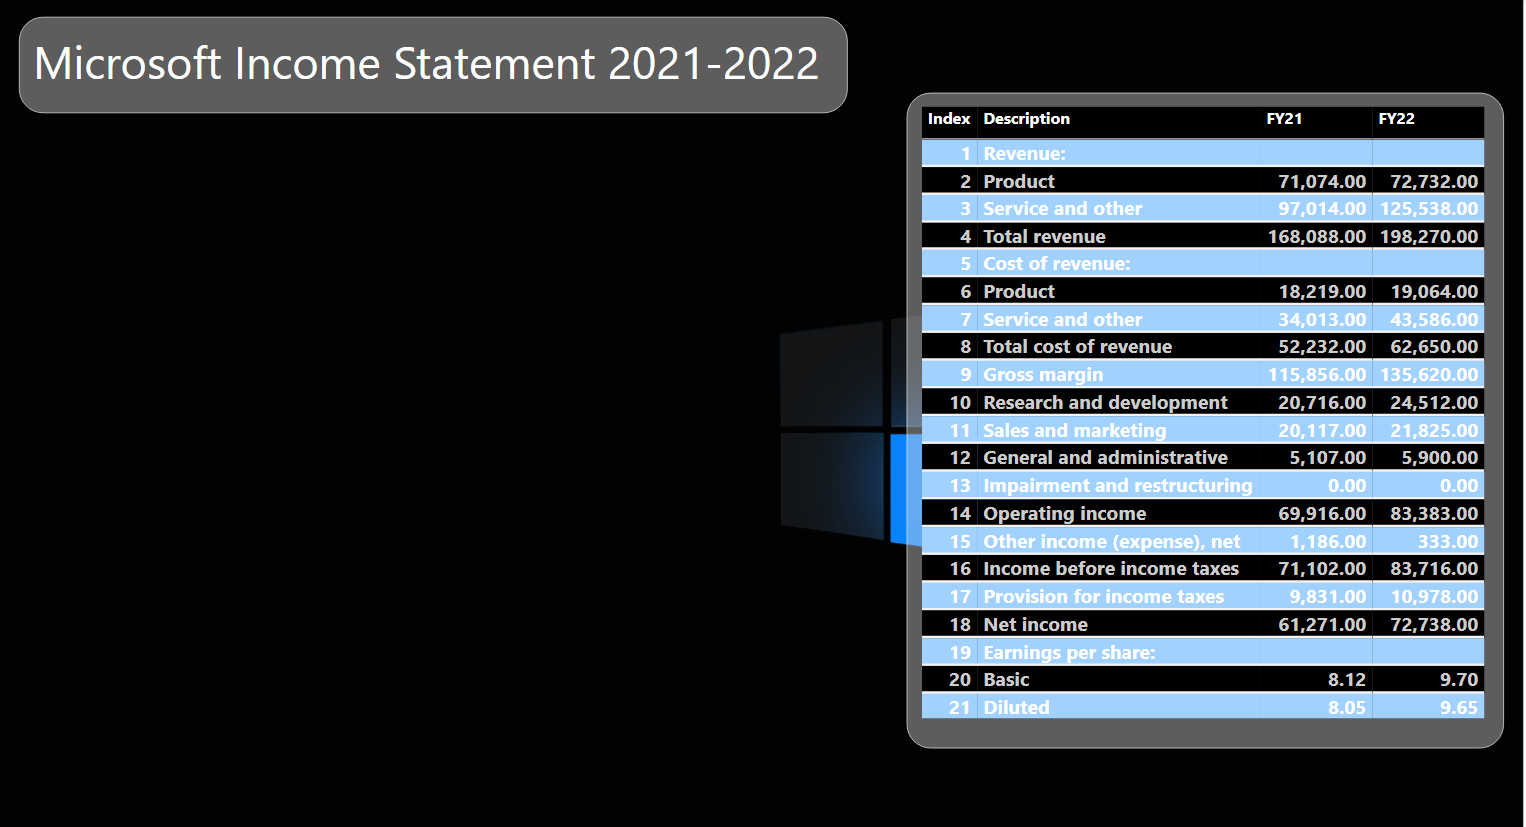
- Copy data table and click enter data, paste it and click edit to open power query editor
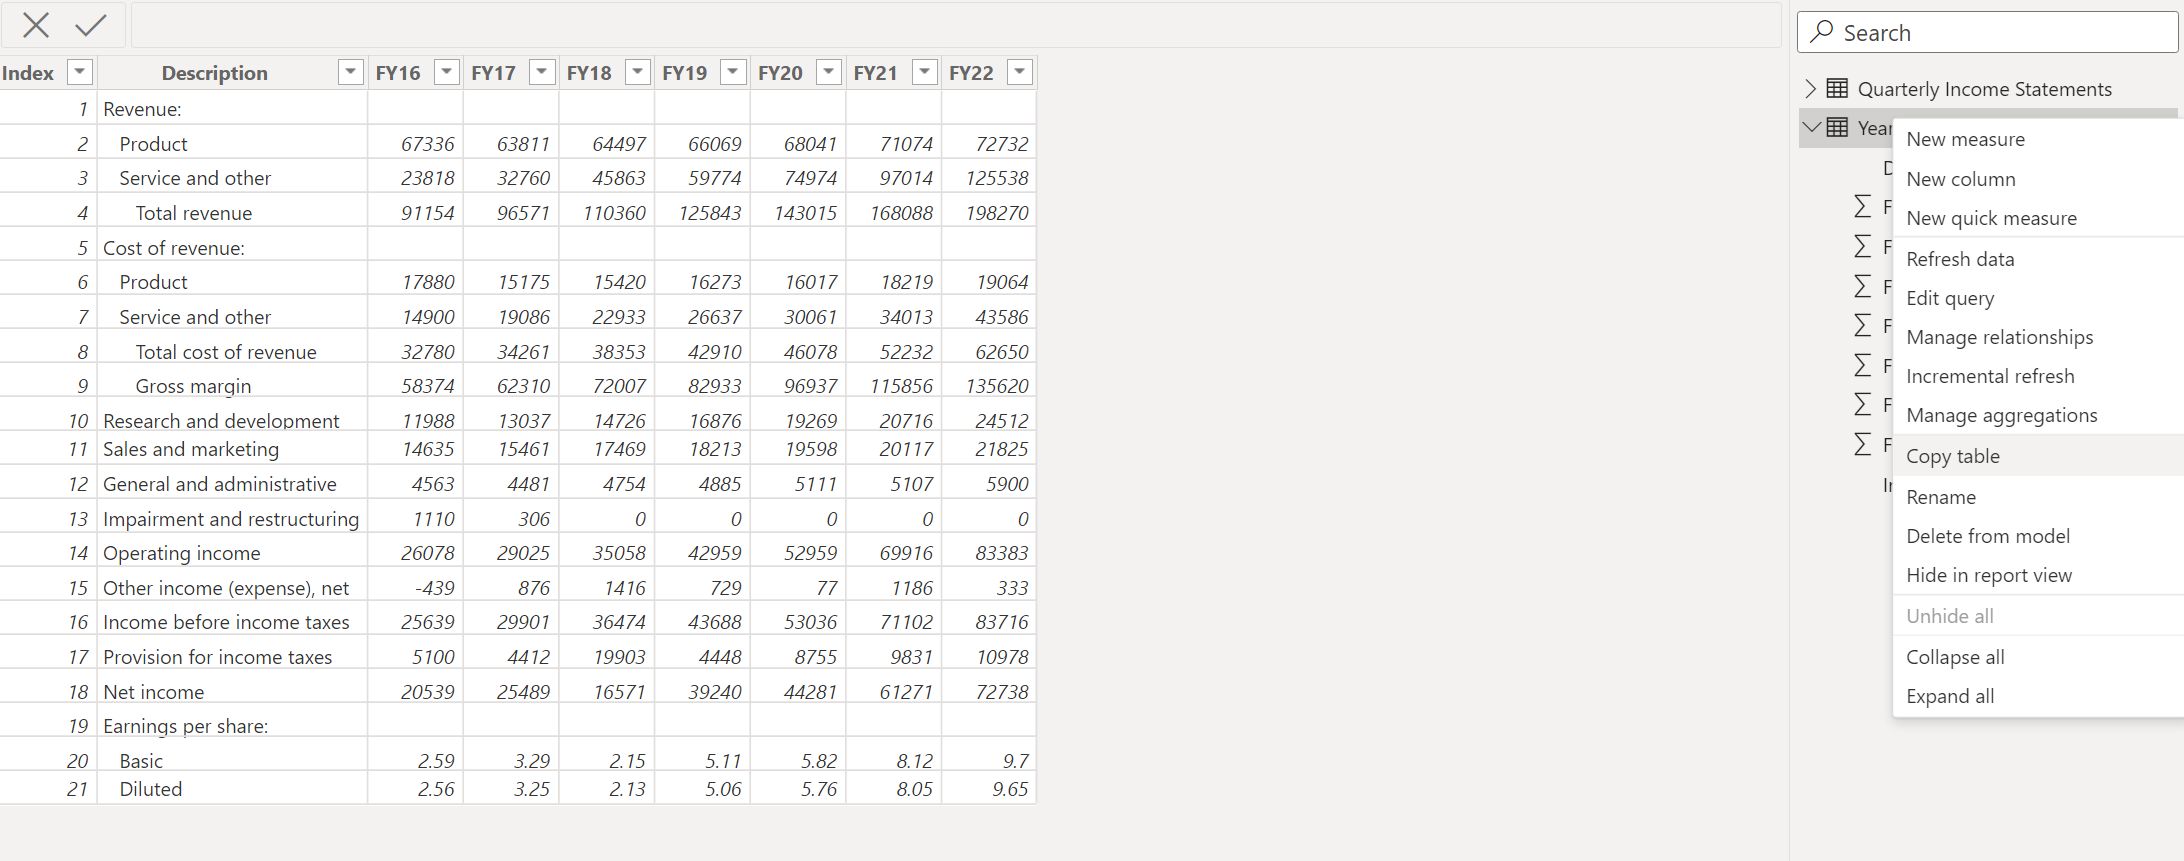
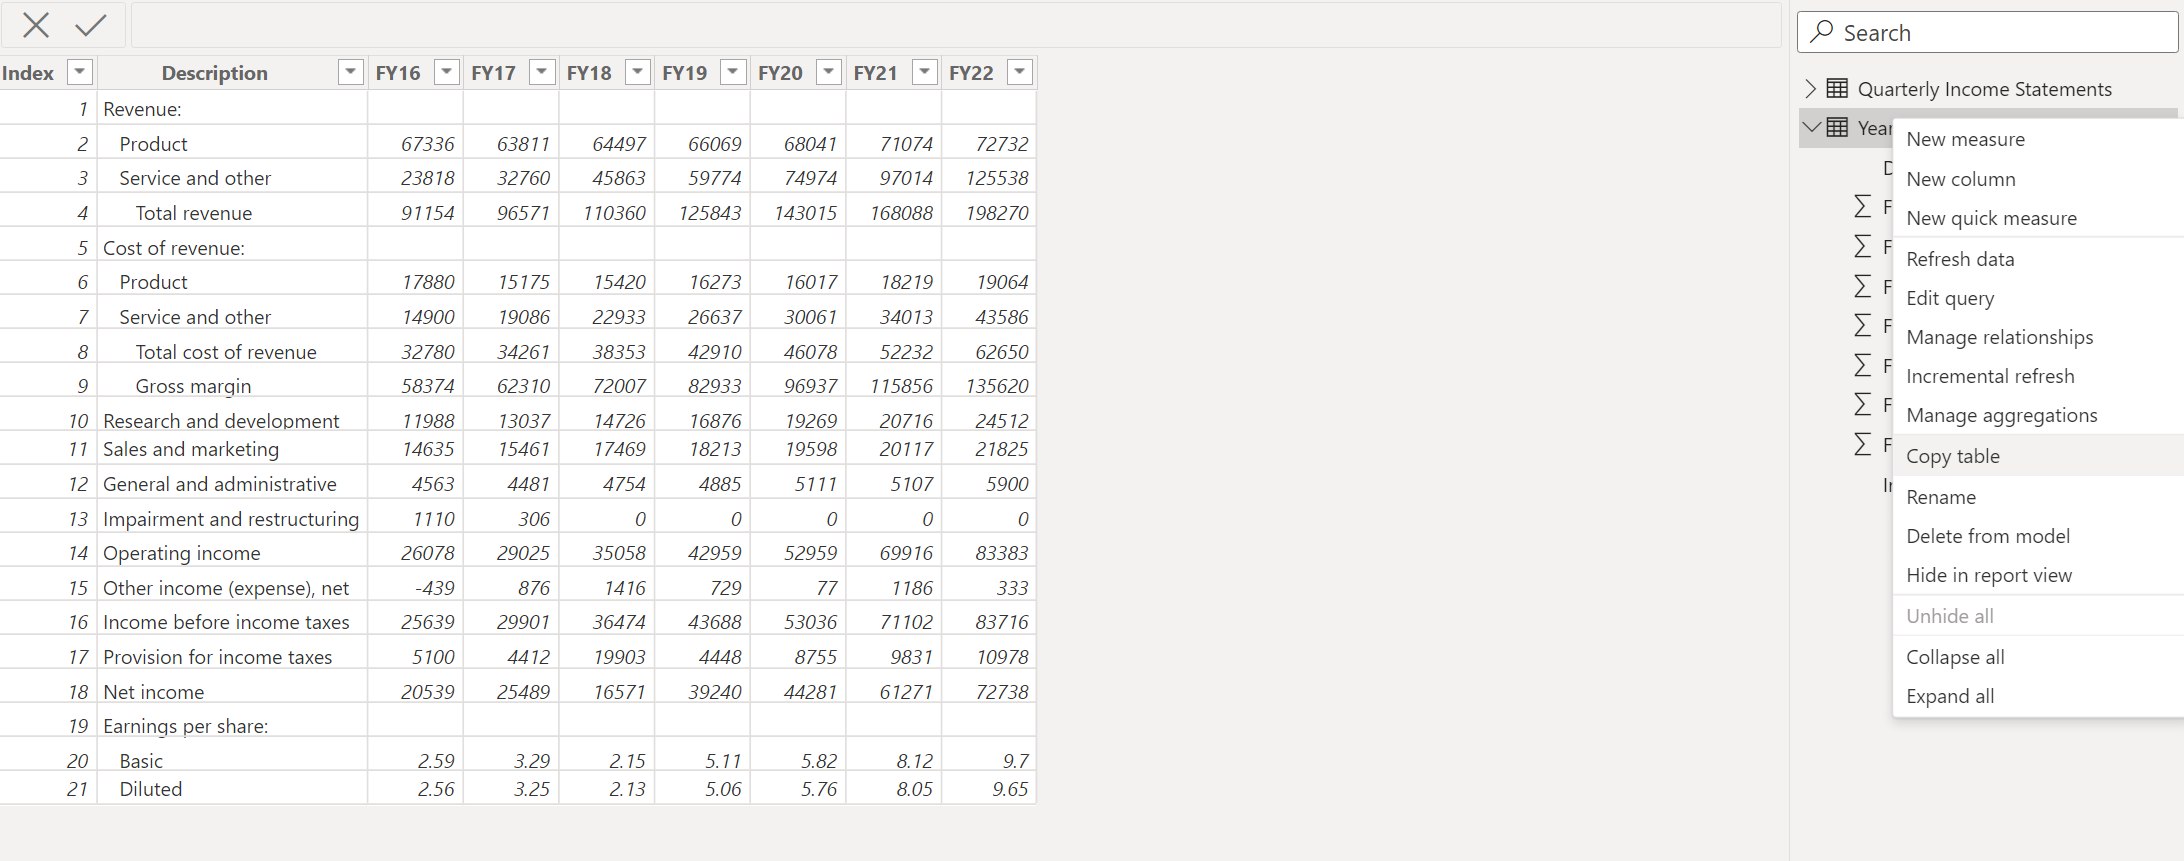
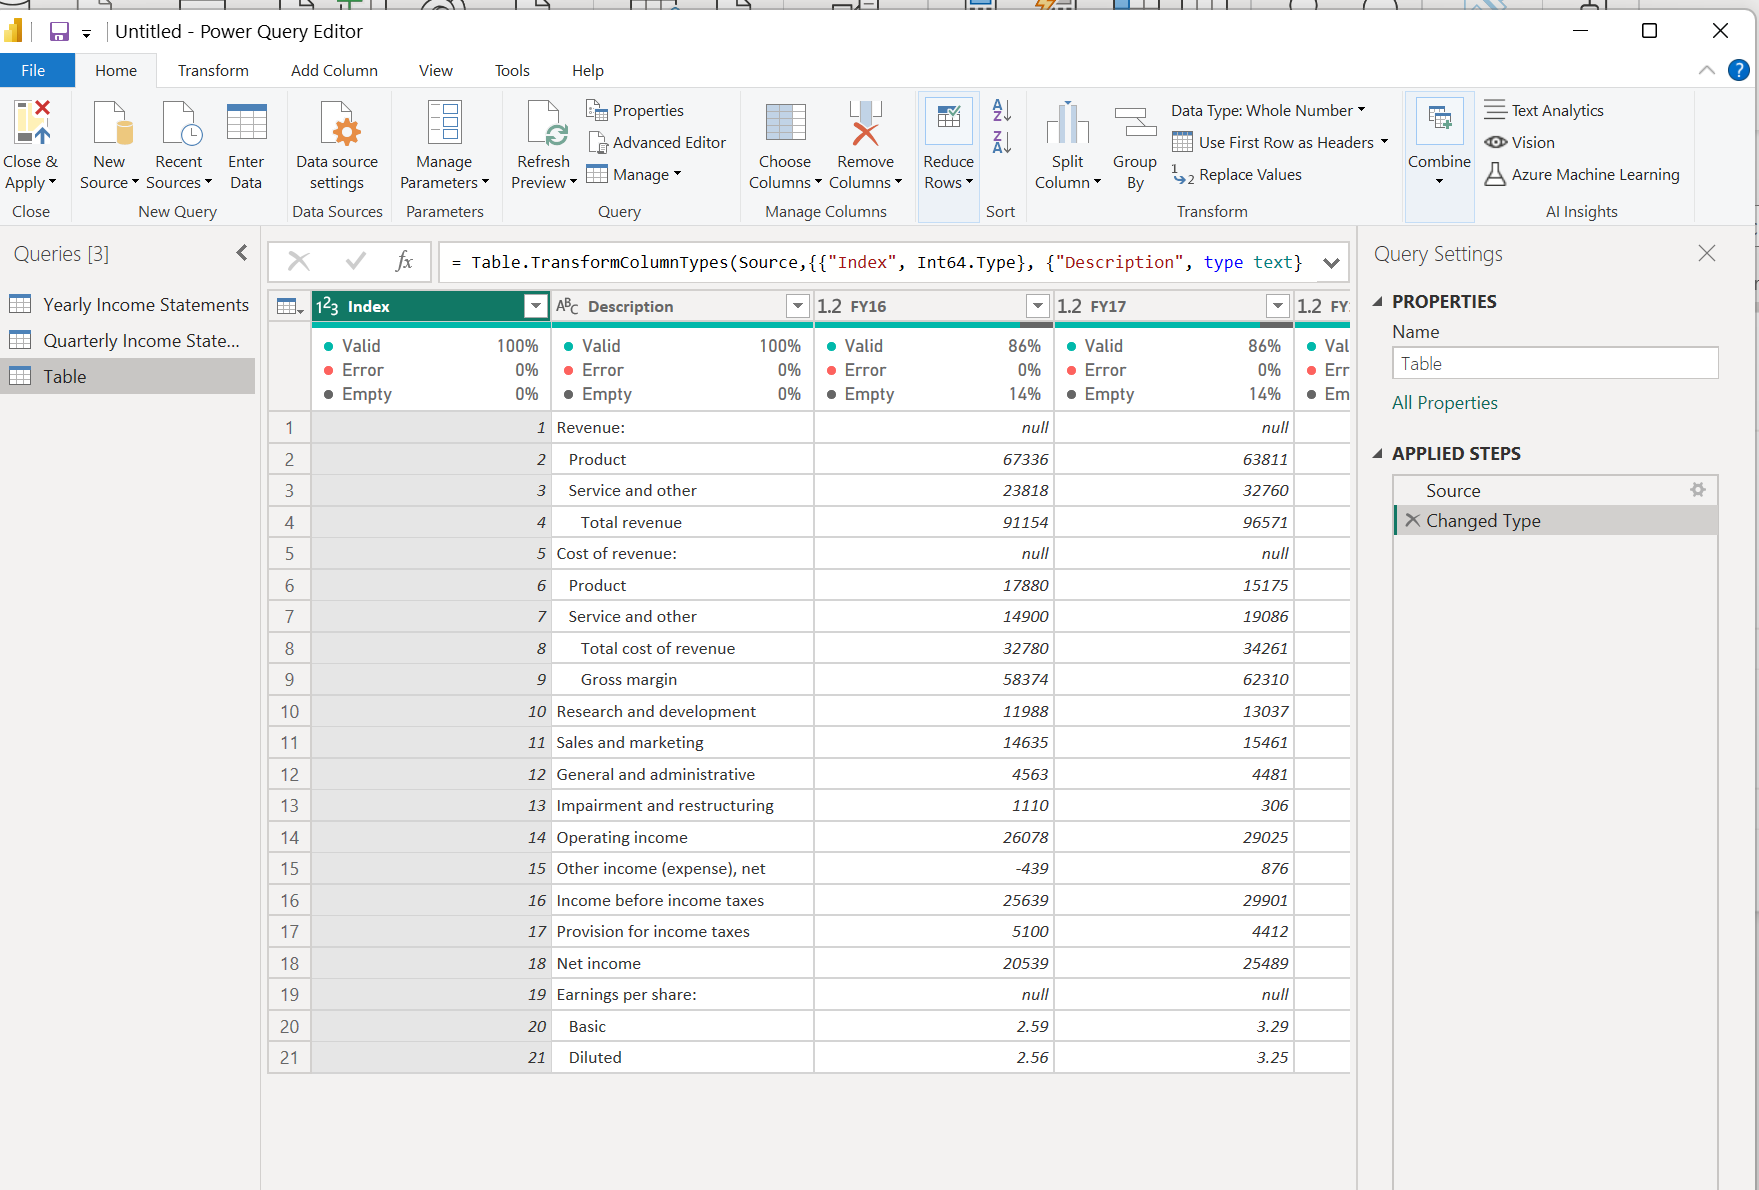
- delete all columns except the below two
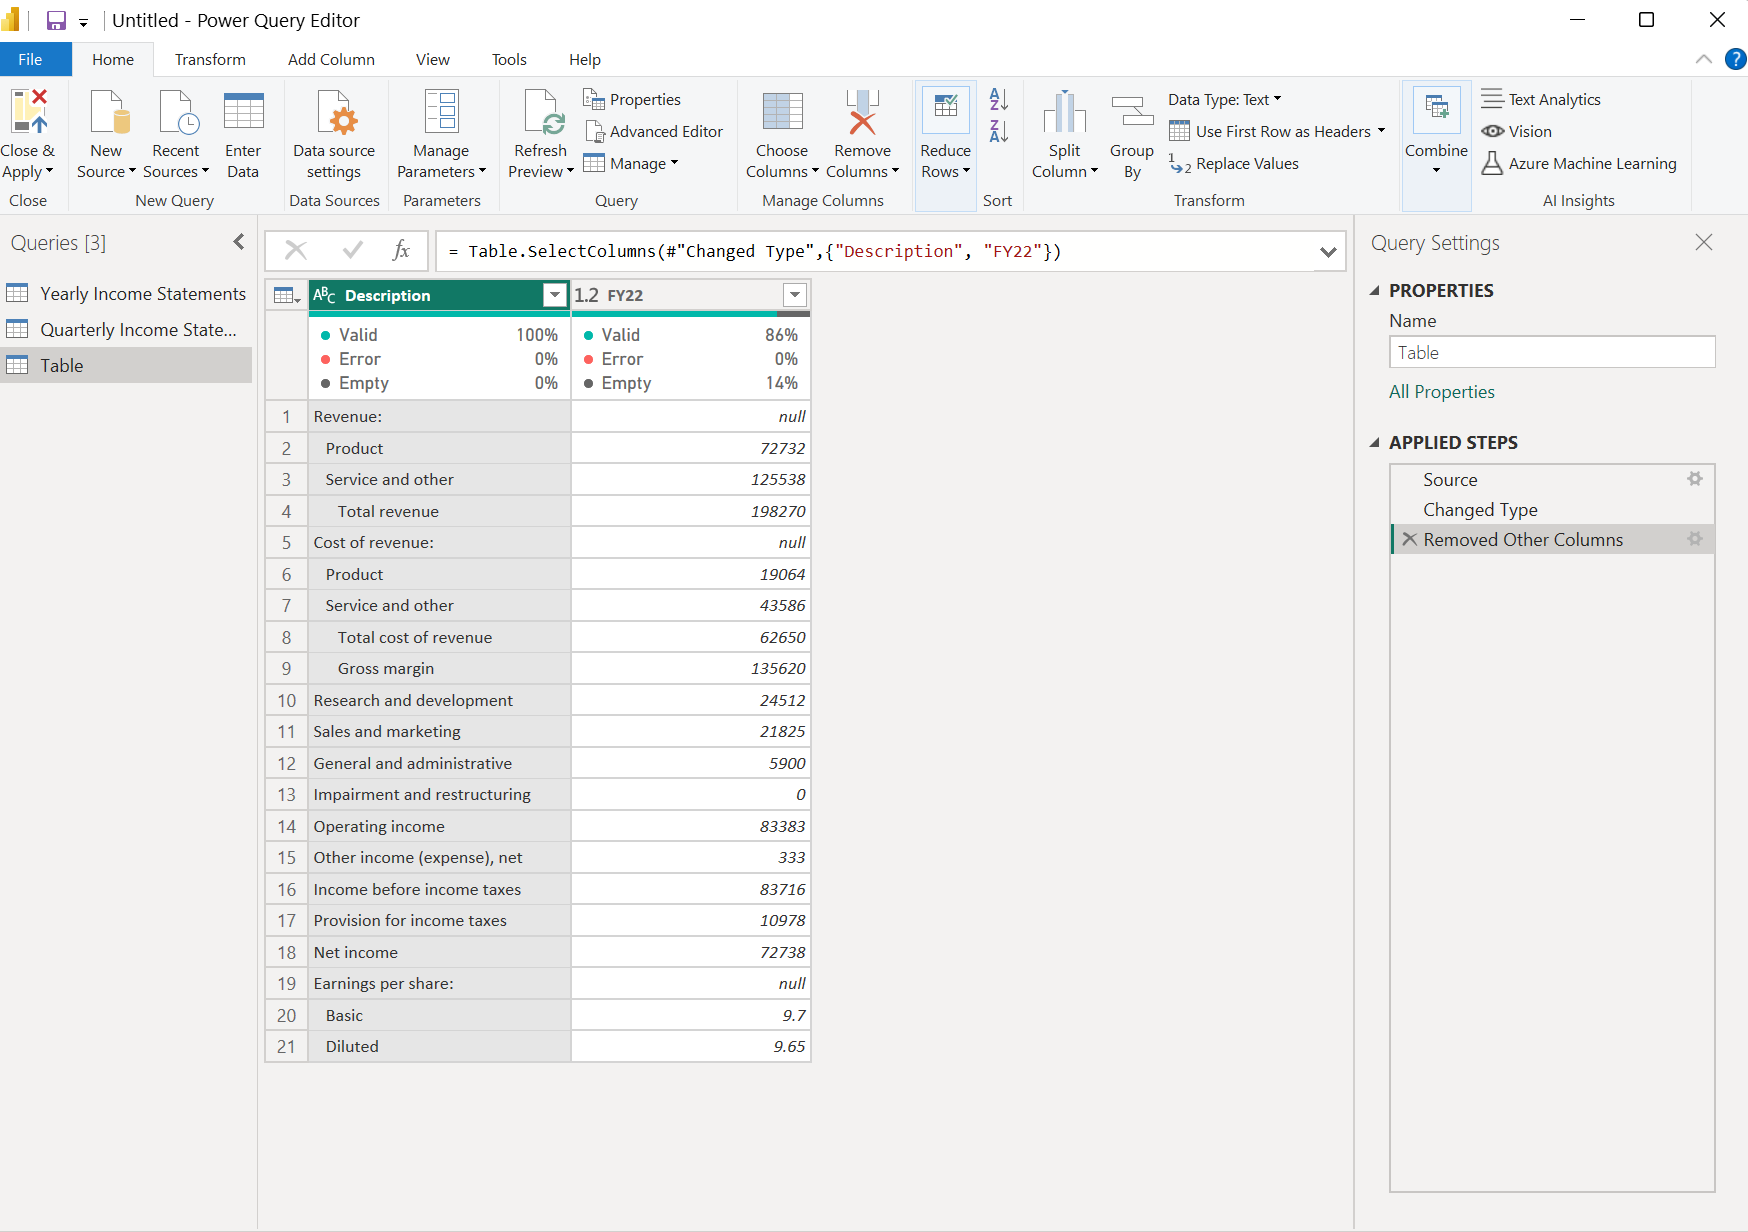
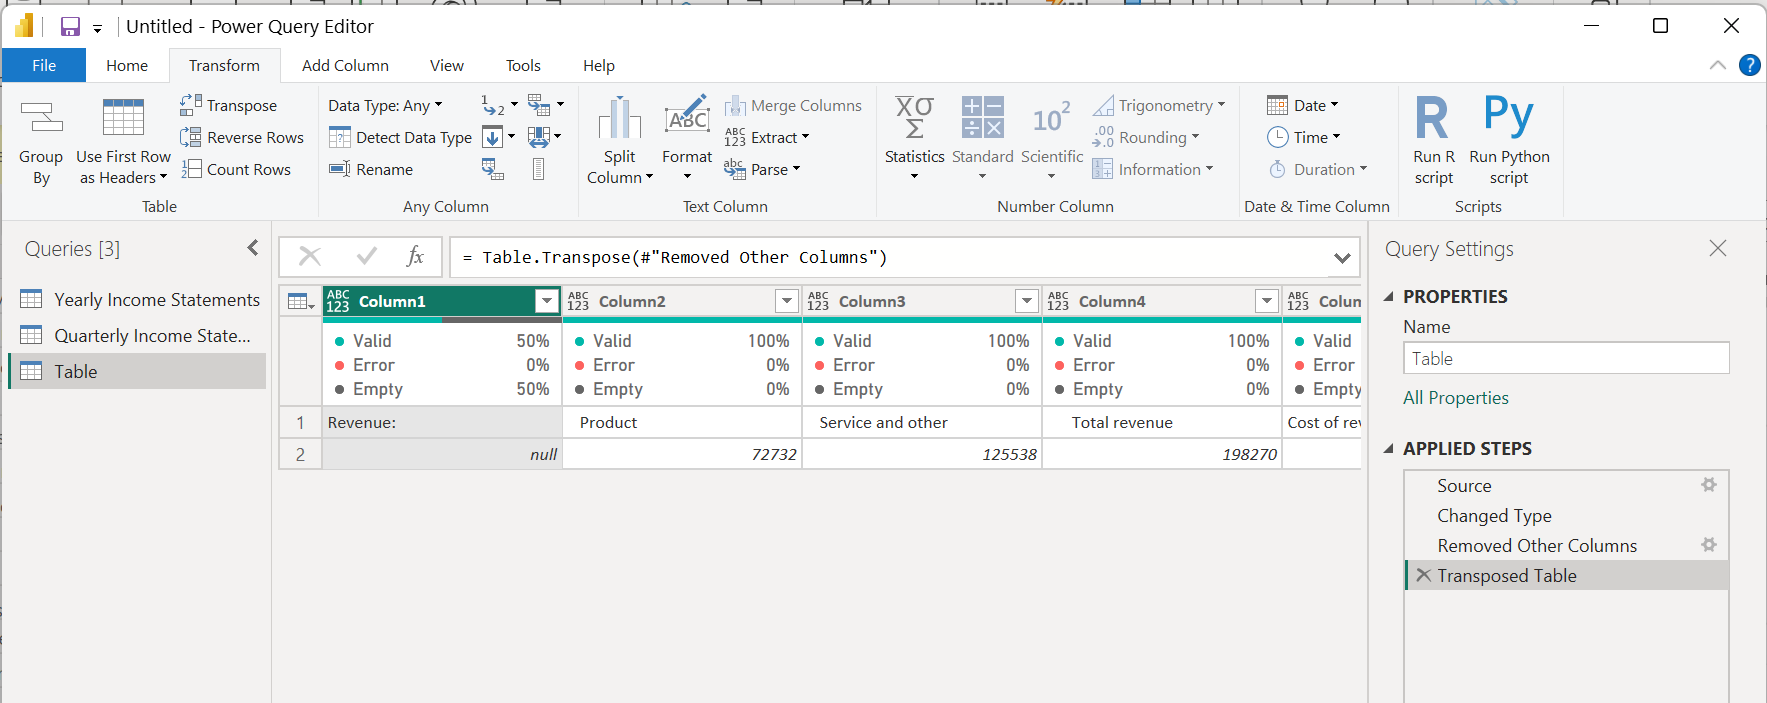
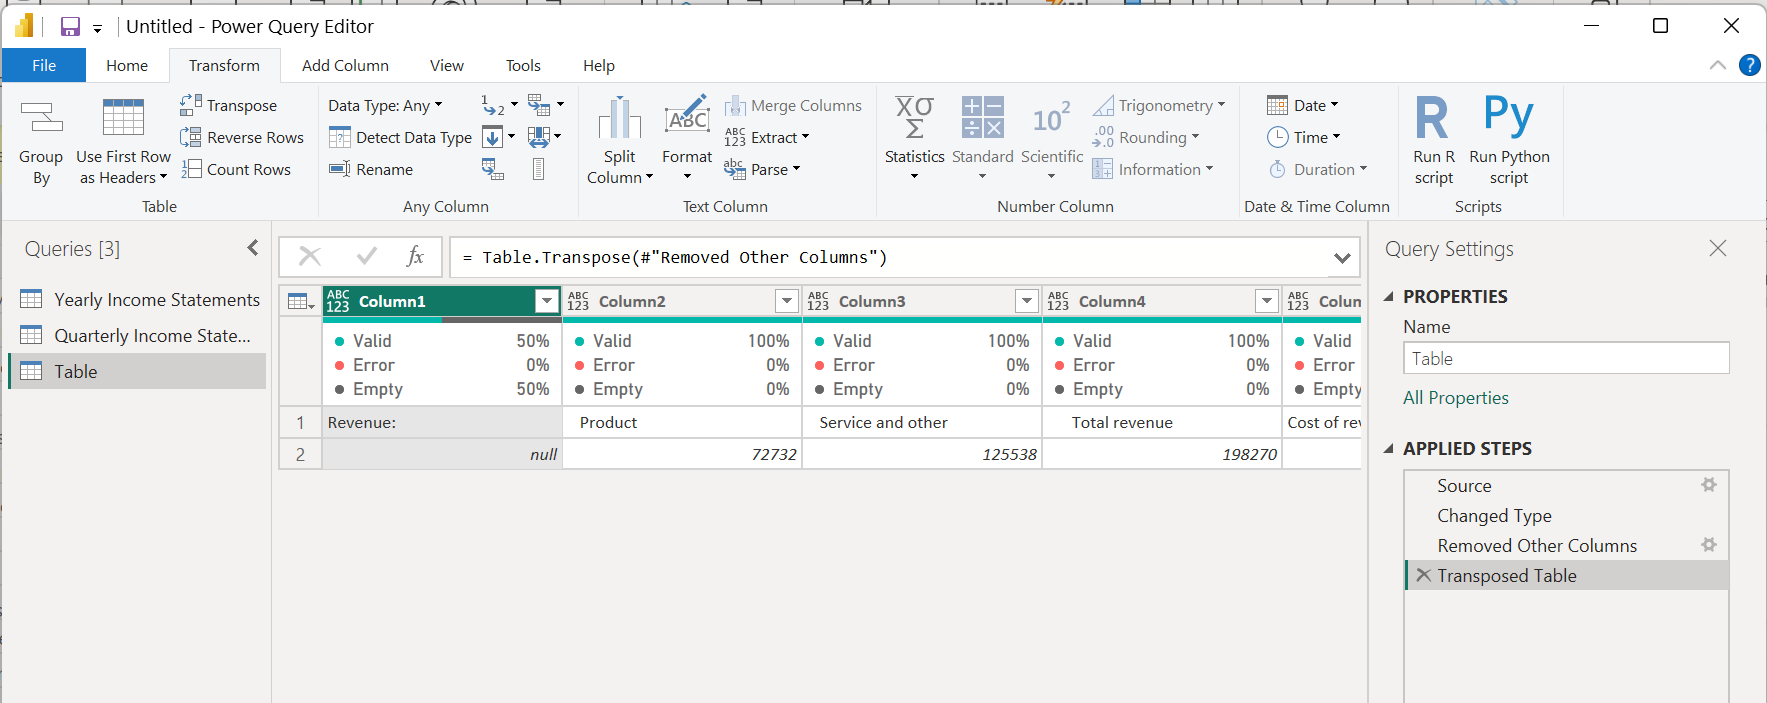
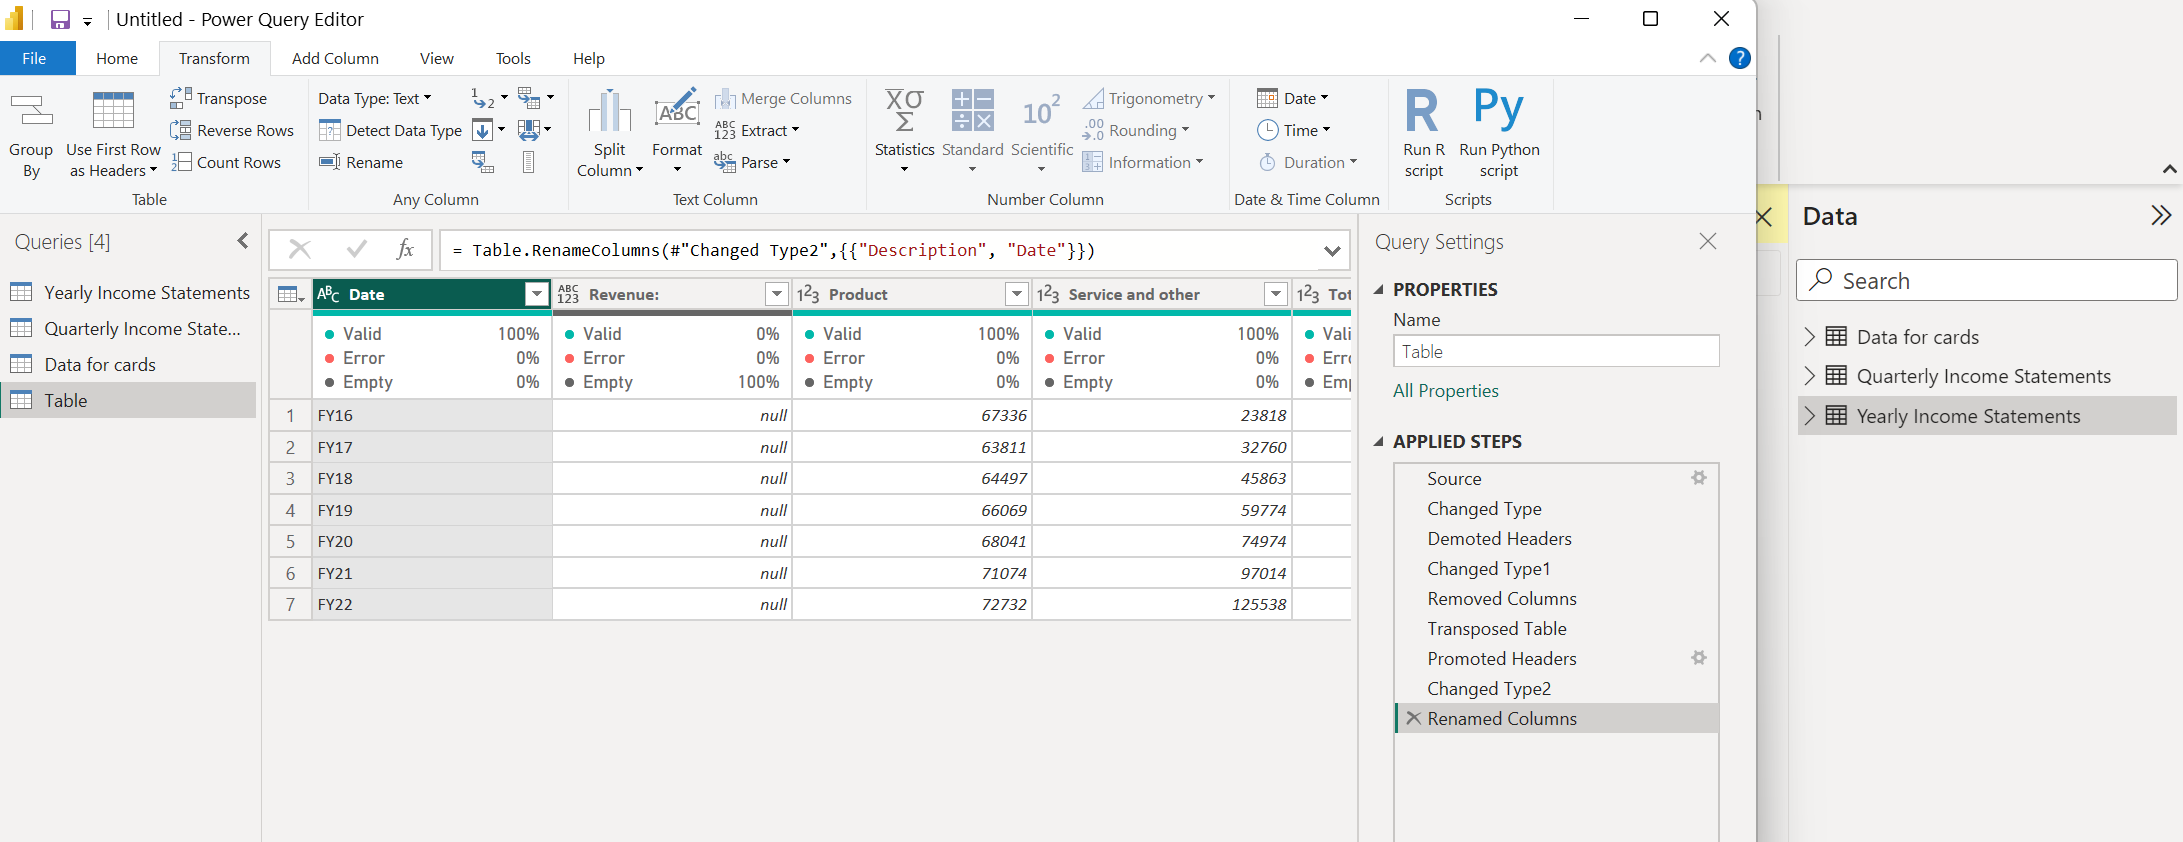
- Turn Rows into Columns and turn the first row into headers and click close and apply , rename table "Data for Cards"
- Create the 3 KPI cards
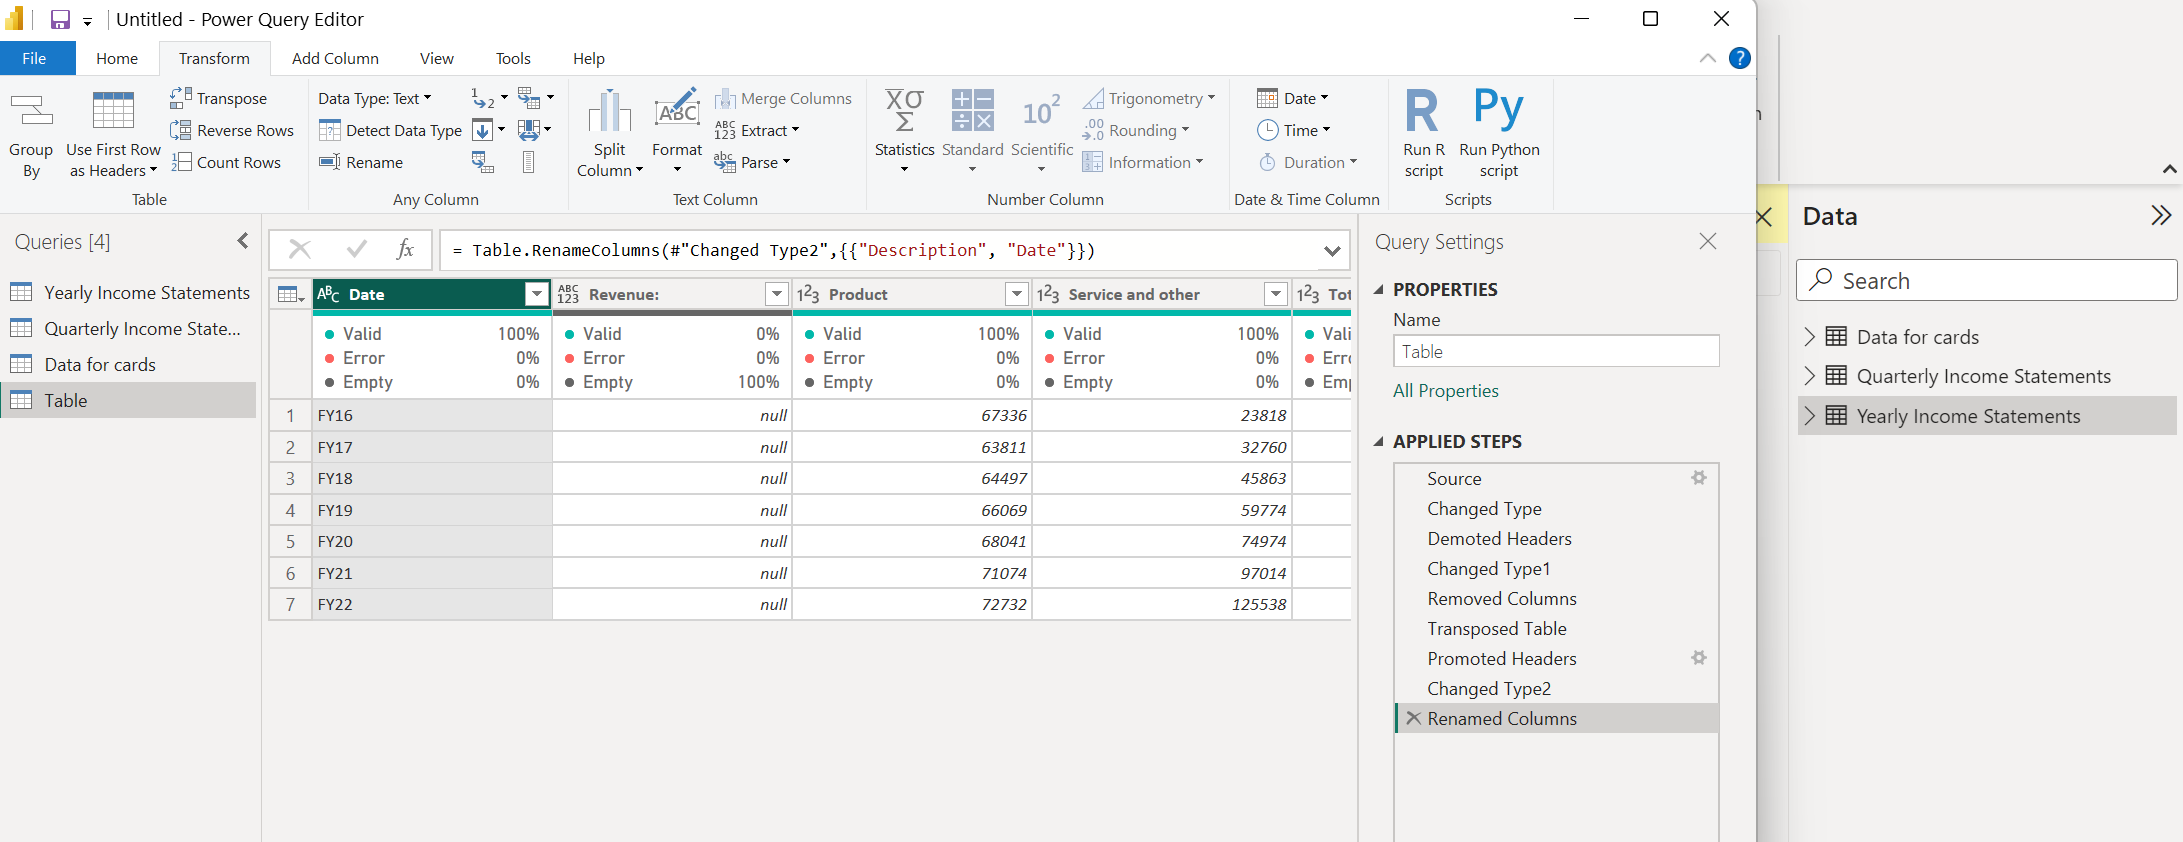
- Do the same steps as before to copy the table, bring the headers as rows and then transpose the table
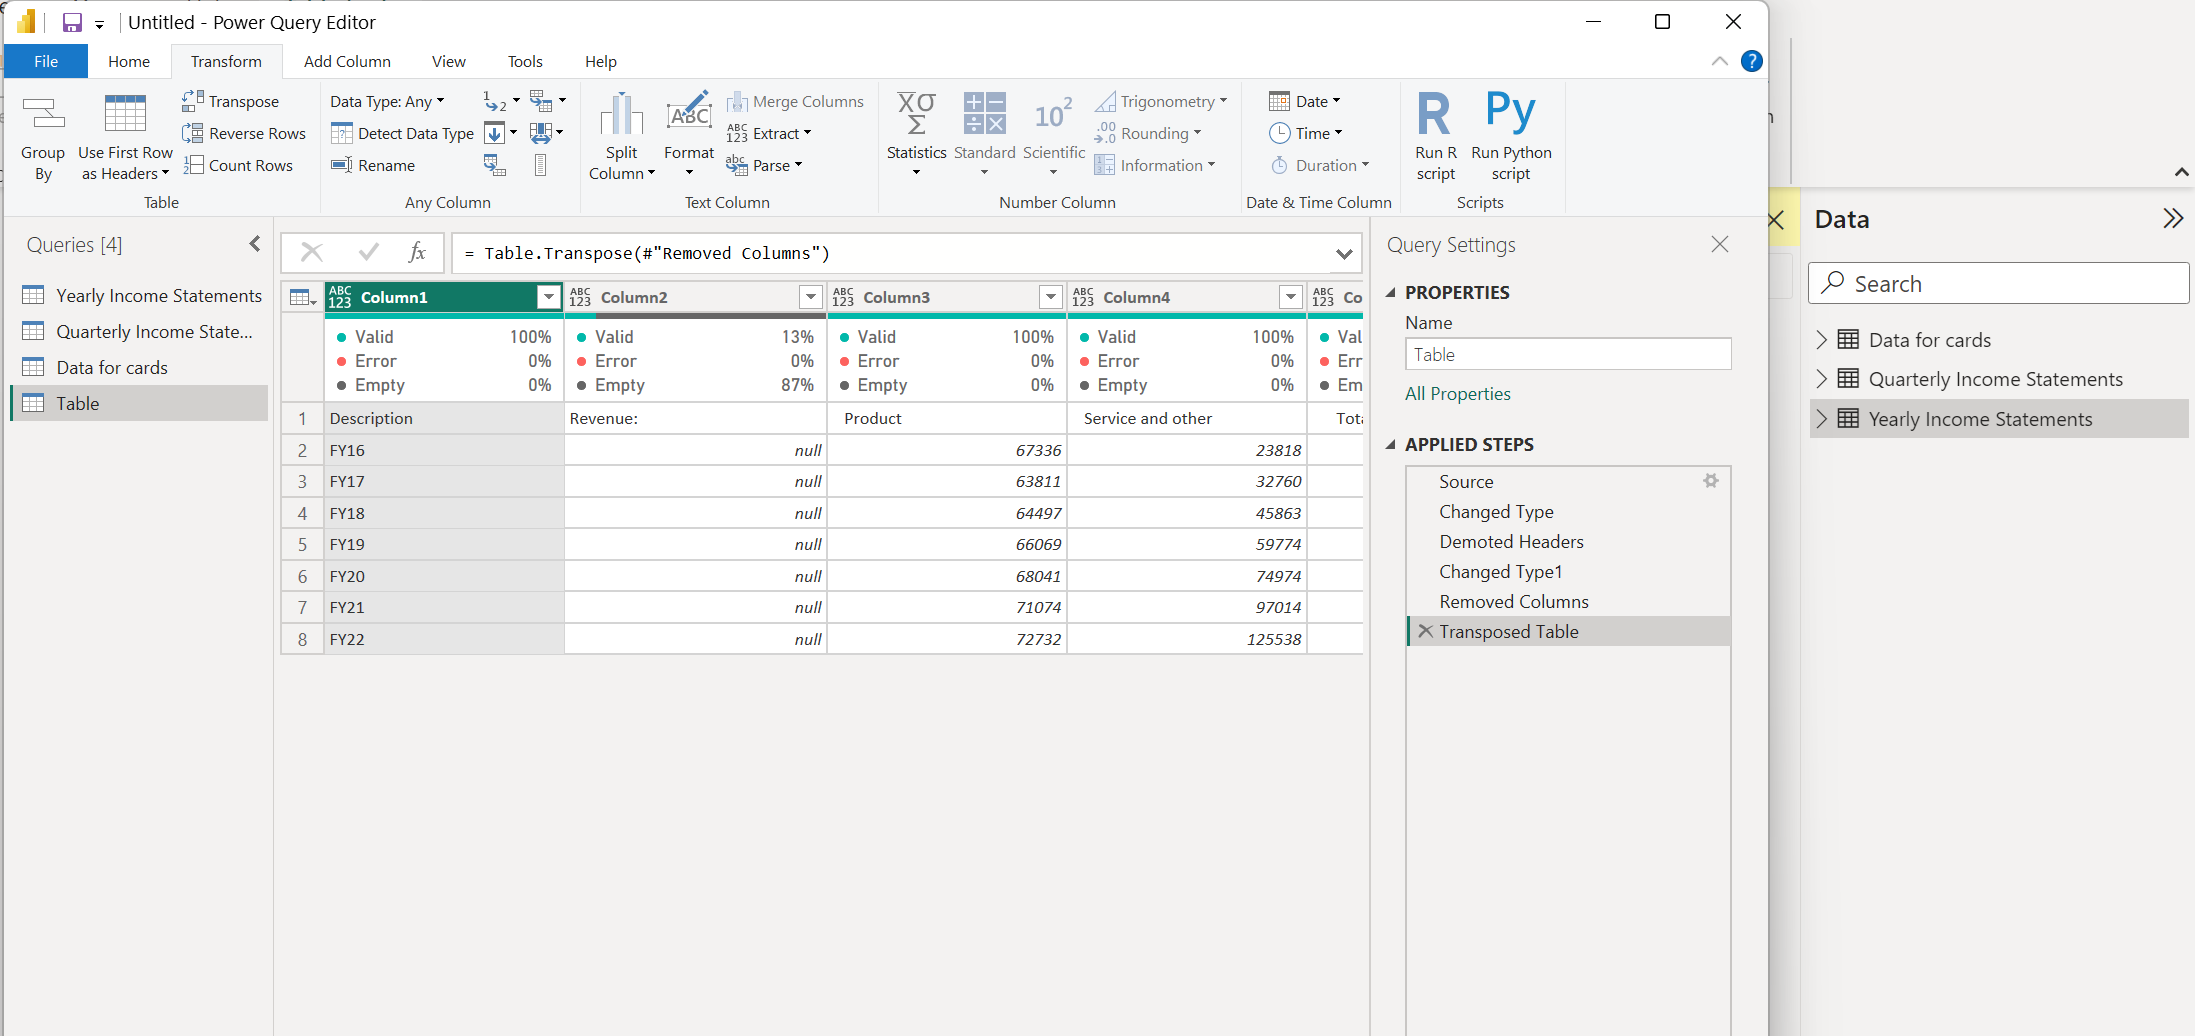
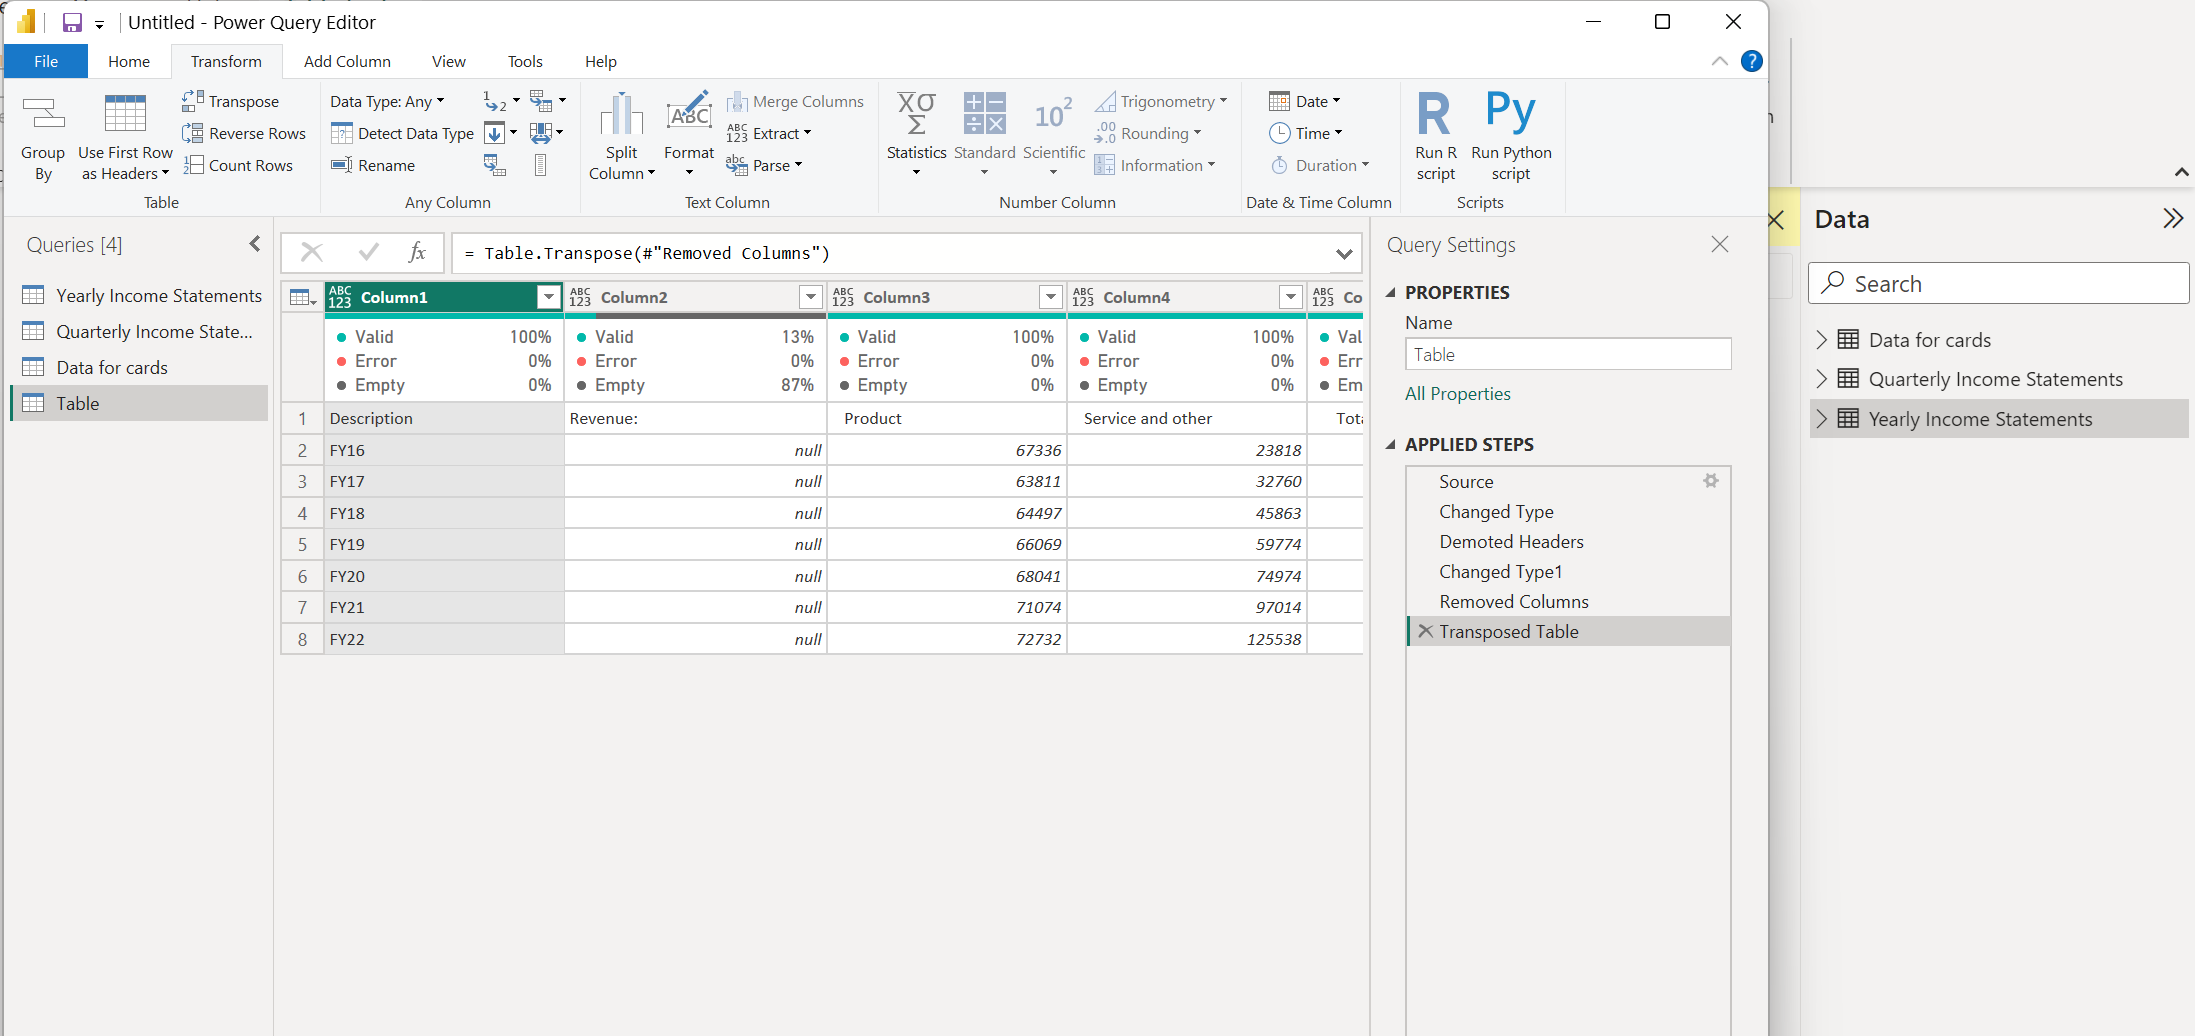
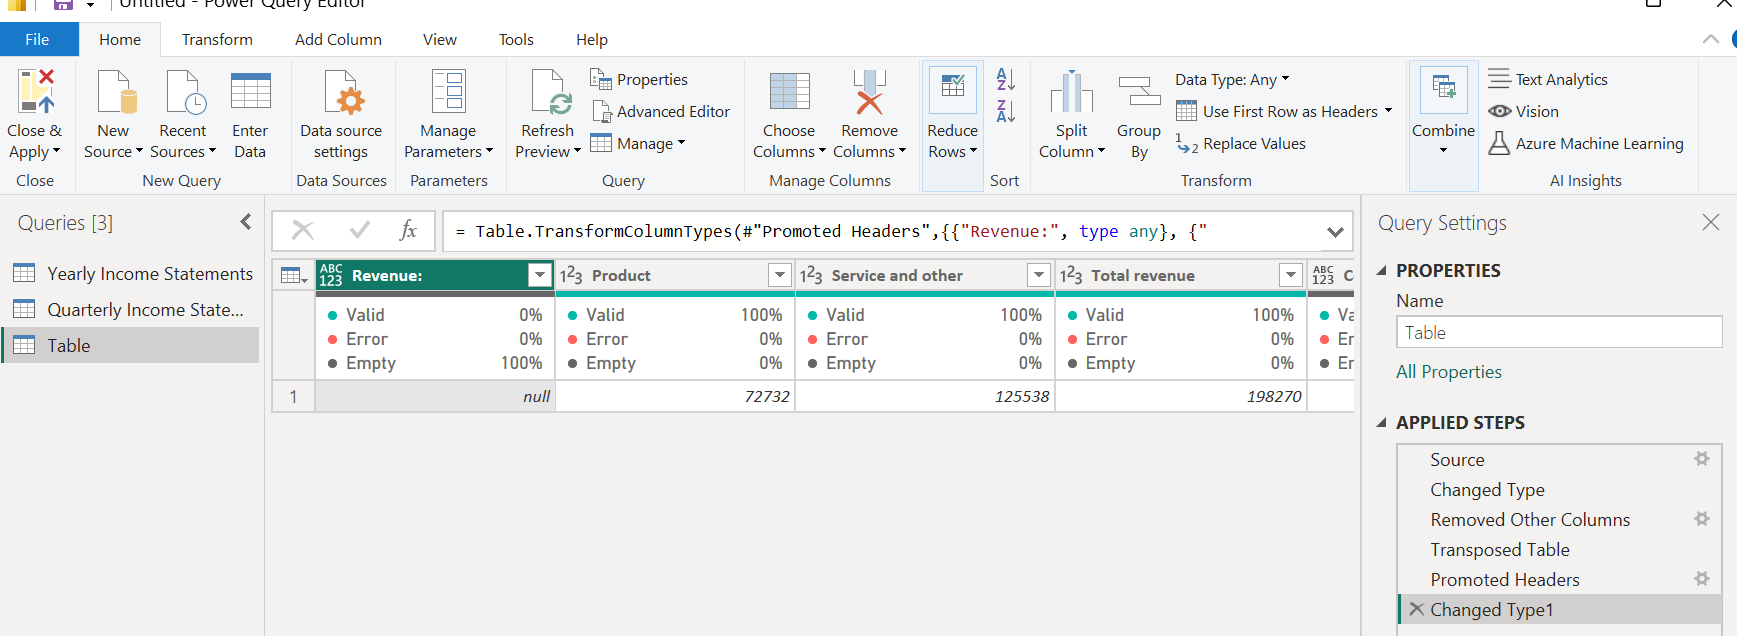
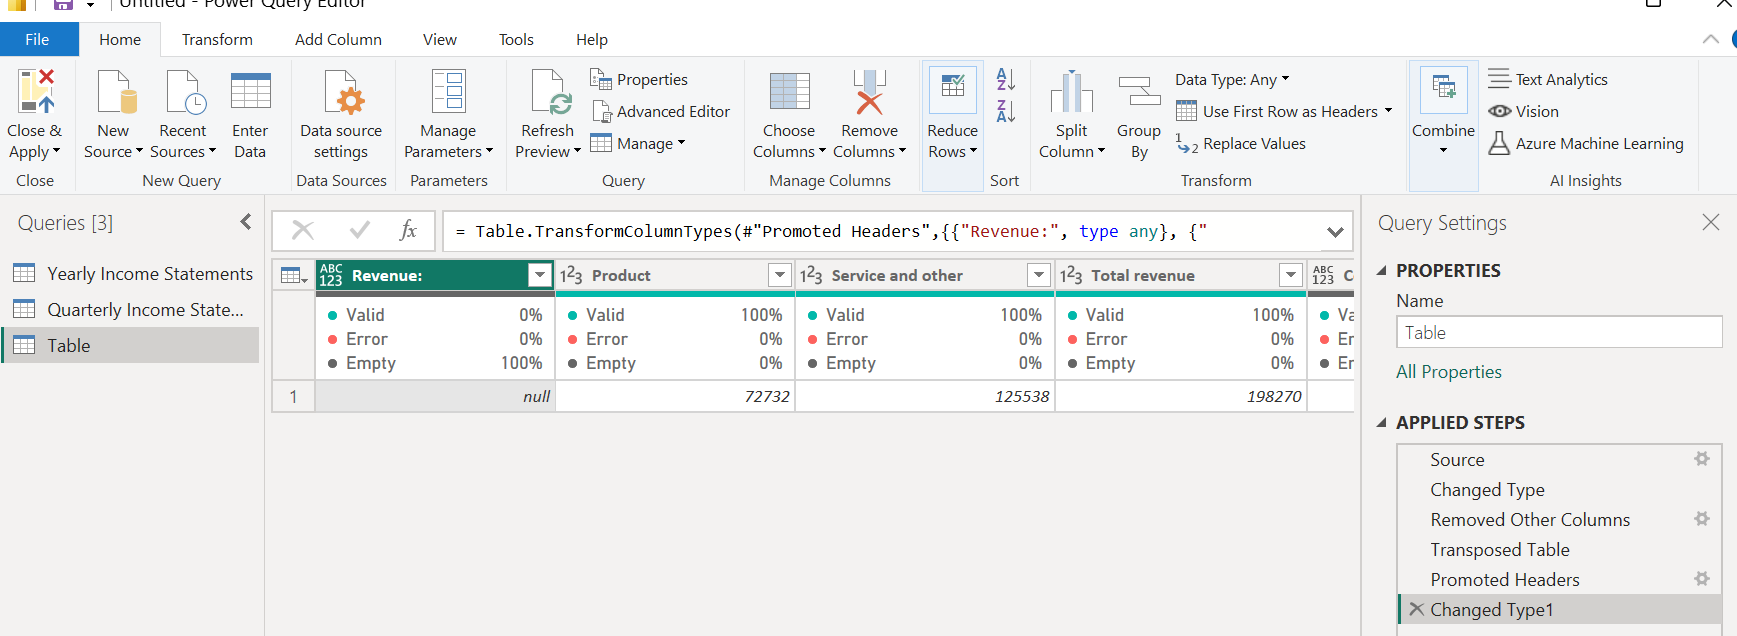
- Add headers back and rename the first column, close and apply, rename table "Data for Charts"
- Final Outcome